
 100% FREE ACCESS
11th Standard CBSE Syllabus & Materials
11th Standard CBSE
CBSE 11th Economics PART-A - Presentation of Data - New Sample Question Papers Study Material - QB365 Set A
NEW11th Standard CBSE
CBSE 11th Economics PART-A - Organisation of Data - New Sample Question Papers Study Material - QB365 Set A
NEW11th Standard CBSE
CBSE 11th Economics PART-A - Collection of Data - New Sample Question Papers Study Material - QB365 Set A
NEW11th Standard CBSE
CBSE 11th Economics PART-A - Introduction to Economics and Statistics - New Sample Question Papers Study Material - QB365 Set A
NEW11th Standard CBSE
CBSE 11th Business Studies International Trade Sample Question Papers Study Material - QB365 Set A
NEW11th Standard CBSE
CBSE 11th Business Studies Evolution and Fundamentals of Business Sample Question Papers Study Material - QB365 Set A

Published on: 30/09/2019
Measures of Central Tendency - Median and Mode
Download CBSE Class 11th Standard CBSE undefined question papers, sample papers, important questions, and previous year solved papers in PDF format. Get free study materials, NCERT solutions, and exam preparation resources for Class 11th Standard CBSE undefined
Questions + Answers key
Take MCQ Biology Test
1.
What are quartiles? How are quartiles, deciles and percentiles different from each other?
2.
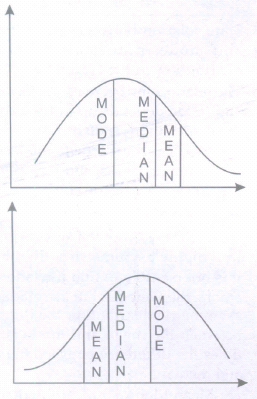
State relation between mean, median and mode in normal and skewed distribution with an example.
3.
Define Mode. Discuss its merits and demerits.
4.
Define Median. Discuss its merits and demerits.
5.
It is known that median of a series is 41 and total frequencies are 82. Find the missing frequency and seventh decile and 90th percentile.
| Class Interval | Frequency |
| 10-20 | 10 |
| 20-30 | F1 |
| 30-40 | 15 |
| 40-50 | 20 |
| 50-60 | F2 |
| 60-70 | 11 |
6.
From the data given below, find Q1 and Q3.
| Pocket Expenses | Frequency |
| 0-10 | 2 |
| 10-30 | 9 |
| 30-100 | 3 |
| 100-500 | 5 |
| 500-1000 | 4 |
| 1000-2000 | 2 |
7.
From the data given below, find Q1 and Q3.
| Wages | No. of workers |
| More than 10 | 50 |
| More than 20 | 35 |
| More than 30 | 25 |
| More than 40 | 20 |
| More than 50 | 18 |
| More than 60 | 10 |
8.
Find the Lower and Upper Quartile in the set of numbers given below:
62, 68, 53, 57, 20, 30, 32, 45, 72, 77, 81
9.
From the data given below, find median.
| Daily Income | No of families |
| Less than 100 | 5 |
| 100-200 | 9 |
| 200-300 | 12 |
| 300-400 | 2 |
| 400 and above | 2 |
1.
Quartile is that value which divides the total distribution into four equal parts. So there are three quartiles, i.e. Q1, Q2 and Q3. Q1, Q2 and Q3 are termed as first quartile, second quartile and third quartile or lower quartile, middle quartile and upper quartile respectively. Quartiles, deciles and percentiles all are positional measures with following difference.
Quartiles divide the series into four equal parts, deciles divide the series into 10 equal parts, and percentiles divide the series into 100 equal parts. Method of their estimation is also similar.
2.
The relationship between mean, median and mode depends upon the nature of the distribution. A distribution may be symmetrical or asymmetrical.
In asymmetrical distribution the mean, median and mode are equal
i.e. Mean(AM) = Median(M)
= Mode(Mo)
In a highly asymmetrical distribution it is not possible to find a relationship among the averages. But in a moderately asymmetric distribution the difference between the mean and mode is three times the difference between the mean and median.
i.e. Mean-Mode = 3(Mean-Median)
In other words, In a normal Distribution,
Mean = Median = Mode
But in a moderately skewed distribution,
Mode = 3Median - 2Mean
This formula can also be used to find mode in case of bimodal series. If this formula is used to find mode, such a mode is called empirical mode. Karl Pearson expressed this relationship as:
Mode = mean - 3 [mean - median]
Mode = 3 median - 2 mean and Median = mode + ()
Knowing any two values, the third can be computed.
Example: Given median = 20.6, mode = 26 Find mean.
Mode = 3 median - 2 mean
\(\therefore\) Mean = () [3 median - mode)
\(\therefore\) Mean = () [3(20.6) - (26)]
\(\therefore\) Mean = () [35.8]
\(\therefore\) Mean = 17.9
3.
Mode is the most frequent item in the series.
Merits:
(a) It is easy to calculate and simple to understand.
(b) It is not affected by the extreme values.
(c) The value of mode can be can be determined graphically.
(d) Its value can be determined in case of open-end class interval.
(e) The mode is the most representative of the distribution.
Demerits:
(a) It is not suitable for further mathematical treatments.
(b) The value of mode cannot always be determined.
(c) The value of mode is not based on each and every items of the series.
(d) The mode is strictly defined.
(e) It is difficult to calculate when one of the observations is zero or the sum of the observations is zero.
4.
According to Connor, "The median is that value of the variable which divides the group into two equal parts, one part comprising all parts greater, and the other values less than median."
According to Horace Secrist, "Median of a series is the value of the item actual or estimated when a series is arranged in order of magnitude which divides the
distribution into two parts."
According to Croxton and Cowden, ''the median is generally defined as the value which divides the distribution so that an equal number of items is on either side of it."
Merits:
(a) The median is useful in case of frequency distribution with open-end classes.
(b) The median is recommended if distribution has unequal classes.
(c) Extreme values do not affect the median as strongly as they affect the mean.
(d) It is the most appropriate average in dealing with qualitative data.
(e) The value of median can be determined graphically where as the value of mean cannot be determined graphically.
(f) It is easy to calculate and understand.
Demerits:
(a) For calculating median it is necessary to arrange the data, where as other averages do not need arrangement.
(b) Since it is a positional average its value is not determined by all the observations in the series.
(c) Median is not capable for further algebraic calculations.
(d) The sampling stability of the median is less as compared to mean.
5.
We can find cumulative frequency as follows:
| Class Interval | Frequency | CF |
| 10-20 | 10 | 10 |
| 20-30 | F1 | 10+F1 |
| 30-40 | 15 | 25+F1 |
| 40-50 | 20 | 45+F1 |
| 50-60 | F2 | 45+F1+F2 |
| 60-70 | 11 | 56+F1+F2 |
It is known that total frequencies are 82.
56 + F1 + F2 = 82; F1 + F2= 26............(i)
Median is 41. Therefore, median lies between 40-50
\(Median=l_1+\frac{(\frac{N}{2}-C)}{f}(i)\)
Where l1=40;f=20;\(\frac{N}{2}=41\);C=25+F1;i=10
\(41=40+\frac{(41-25-F1)}{20}(10)\)
On solving the equation,
F1 = 80 + 41 - 25 - 82 = 14
F1 = 14
On putting this value I equation (i), we get,
14 + F2 = 26
F2 = 12
Cumulative frequency now is:
| Class Interval | Frequency | CF |
| 10-20 | 10 | 10 |
| 20-30 | 14 | 24 |
| 30-40 | 15 | 39 |
| 40-50 | 20 | 59 |
| 50-60 | 12 | 71 |
| 60-70 | 11 | 82 |
D7 = Size of 7(82)/10 item = 57.2 item
It lies in 40-50. It can be calculated by applying the formula:
\(D_7=\frac{(\frac{7N}{10}-C)}{f}(h)\)
Where l1=40;f=20;\(\frac{N}{2}=57.5\);C=39;i=10
\(D_7=40+\frac{(57.5-39)}{20}(10)=49.25\)
\(P_{90}=size\ of\frac{90N}{100}th\ item\ of\ the\ series\)
90 (82)/100 = 72.8th item
It lies in the class 60-70
Interpolation formula for continuous series:
\(P_{90}=l_1+\frac{(\frac{90N}{100}-C)}{f}(h)\)
Where l1=60;f= frequency corresponding to Pi class
\(\frac{iN}{100}=72.8;\)C=71;f=11;h=10
\(P_{90}=60+\frac{(72.8-71)}{11}(10)=61.63\)
6.
| Pocket expenses | Frequency | Cumulative Frequency |
| Less than 10 | 2 | 2 |
| Less than 30 | 9 | 11 |
| Less than 100 | 3 | 14 |
| Less than 500 | 5 | 19 |
| Less than 1000 | 4 | 23 |
| Less than 2000 | 2 | 25 |
\(Q_1=\frac{n}{4}th\ observation\frac{25}{4}=6.25th\ observation\)
Q1 class is 10-30
\(Q_1=l_1+\frac{(\frac{N}{4}-C)}{f}(i)\)
Where l1=10;f=9;\(\frac{N}{4}=6.25\);C = 5; i = 20
\(Q_1=10+\frac{(6.25-2)}{9}(20)=21.66\)
\(Q_3=\frac{3(n)}{4}th\ observation\frac{3(25)}{4}=18.75\ observation\)
Q3 class is 100-500
Then Quartile of a continuous series can be calculated by the below interpolation formula.
\(Q_3=l_1+\frac{(\frac{3N}{4}-C)}{f}(i)\)
Where l1=100;f=5;\(\frac{3N}{4}=18.75\);C = 14; i = 400
\(Q_3=100+\frac{(18.75-14)}{5}(400)=480\)
7.
Wages (class interval) |
No. of workers | Cumulative Frequency (Less than type) |
| 10-20 | 15=50-35 | 15 |
| 20-30 | 10=35-25 | 25 |
| 30-40 | 5=25-20 | 30 |
| 40-50 | 2=20-18 | 32 |
| 50-60 | 8=18-10 | 40 |
| 60 and above | 10=10 | 50 |
\(Q_1=\frac{n}{4}th\ observation\frac{50}{4}=12.5th\ observation\)
Q1 class is 10-20
\(Q_1=l_1+\frac{(\frac{N}{4}-C)}{f}(i)\)
Where l1=10;f=15;\(\frac{N}{4}=12.5\);C = 0; i = 10
\(Q_1=10+\frac{(12.5-0)}{15}(10)=18.33\)
\(Q_3=\frac{3(n)}{4}\ observation\frac{3(50)}{4}=37.50\ observation\)
Q3 class is 50-60
Then Quartile of a continuous series can be calculated by the below interpolation formula.
\(Q_3=l_1+\frac{(\frac{3N}{4}-C)}{f}(i)\)
Where l1=50;f=8;\(\frac{3N}{4}=37.5\);C=32;i=10
\(Q_3=50+\frac{(37.5-32)}{8}(10)=56.875\)
8.
| Serial Number | Value |
| 1 | 20 |
| 2 | 30 |
| 3 | 32 |
| 4 | 45 |
| 5 | 53 |
| 6 | 57 |
| 7 | 62 |
| 8 | 68 |
| 9 | 72 |
| 10 | 77 |
| 11 | 81 |
\(Q_1=\frac{n+1}{4}\ observation\frac{11+1}{4}\ observation=32\)
\(Q_3=\frac{3(n+1)}{4}th\ observation\frac{3(11+1)}{4}=9th\ observation=72\)
9.
| Daily Income | No of families |
| Less than 100 | 5 |
| Less than 200 | 14 |
| Less than 300 | 26 |
| Less than 400 | 28 |
| Less than 500 | 30 |
Median = size of \(\frac{N}{2}\) Item
Median = size of \(\frac{30}{2}=15\) item 15th item lies in 200-300
We can find median by using the formula equal to
\(Median=l_1+\frac{(\frac{N}{2}-C)}{f}(i)\)
Where l1=200;f=12;\(\frac{N}{2}=15\);C=14;i=100
\(Median=200+\frac{15-14}{12}(100)=208.33\)

11th Standard CBSE Syllabus & Materials
11th Standard CBSE
CBSE 11th Business Studies Forms of Business Organisation Sample Question Papers Study Material - QB365 Set A
NEW11th Standard CBSE
CBSE 11th Business Studies Business, Trade and Commerce Sample Question Papers Study Material - QB365 Set A
NEW11th Standard CBSE
CBSE 11th Physics Waves Sample Question Papers Study Material - QB365 Set A
NEW11th Standard CBSE
CBSE 11th Physics Kinetic Theory Sample Question Papers Study Material - QB365 Set A



CBSE 11th Standard CBSE Subjects
CBSE Standards










