
 100% FREE ACCESS
7th Standard CBSE Syllabus & Materials
7th Standard CBSE
CBSE 7th Social Science Theme E - Understanding Market - New Sample Question Papers Study Material - QB365 Set A
NEW7th Standard CBSE
CBSE 7th Social Science Theme E - From Barter to Money - New Sample Question Papers Study Material - QB365 Set A
NEW7th Standard CBSE
CBSE 7th Social Science Theme D - The Constitution of India- An Introduction - New Sample Question Papers Study Material - QB365 Set A
NEW7th Standard CBSE
CBSE 7th Social Science Theme D - From the Rulers to the Ruled : Types of Governments - New Sample Question Papers Study Material - QB365 Set A
NEW7th Standard CBSE
CBSE 7th Social Science Theme B - The Age of Reorganisation - New Sample Question Papers Study Material - QB365 Set A
NEW7th Standard CBSE
CBSE 7th Social Science Theme B - The Rise of Empires - New Sample Question Papers Study Material - QB365 Set A

Published on: 31/10/2025
Download CBSE Class 7th Standard CBSE Mathematics question papers, sample papers, important questions, and previous year solved papers in PDF format. Get free study materials, NCERT solutions, and exam preparation resources for Class 7th Standard CBSE Mathematics
Questions + Answers key
Take MCQ Mathematics Test
1.
Find the median and mode of the following data
110, 140, l30, 120, 140, 120, 120, l30, 120, 110
2.
Discuss with your friends and give
Two situations where mode would be an appropriate representative value to use
3.
In different cities the average weight (in gram) of protein food provided per child under the age of 15 years is as follows:
80, 90, 75, 110, 90, 80, 85, 90, 110, 80, 75, 80, 110, 90, 85, 80, 75, 90, 85, 110, 90, 90, 75, 110, 85
(a) On the basis of given data make a frequency distribution table.
(b) Which mathematical concept is used in this problem?
(c) What is its value?
4.
If the mean of five observations x, x + 2, x + 4, x + 6, x + 8, is 11. Find the mean of first three observations.
5.
On the basis of following frequency table find the mean marks:
| Marks | 20 | 30 | 40 | 50 | 60 | 70 |
| No. of students | 12 | 45 | 48 | 5 | 32 | 40 |
6.
Observe the data and answer the questions that follow: 16,15,16,16,8,15,17 - What is the least number of values that must be put into, to change the mode to 17? Name them.
7.
Following cards are put facing down
| A | E | I | O | U |
What is the chance of drawing out
(a) a vowel?
(b) a card marked U?
(c) A or I?
(d) a consonant?
8.
Use the following bar graph to answer the questions:
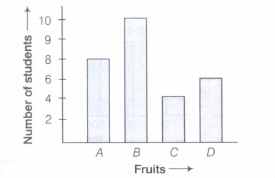
A = Orange; B = Mango; C = Grapes; D = Apple
Which is the least popular fruit among the students?
9.
A coin is tossed 100 times and head is obtained 59 times on tossing a coin at random. Find the probability of getting (a) a head (b) a tail.
10.
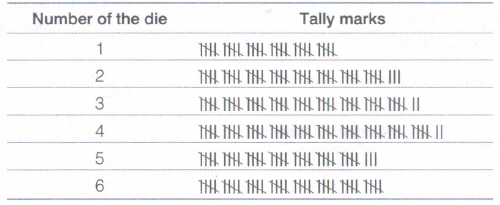
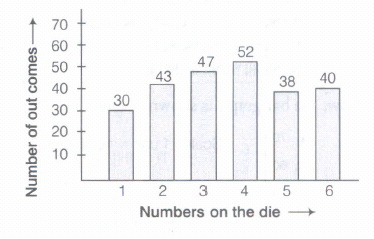
Aftaab threw a die 250 times and got the following table. Draw a bar graph for this data
11.
The following table shows wheat and rice productions (in tonne) in five consecutive years. Draw a double bar graph choosing appropriate scale and answer the following:
| Years | 1970 | 1971 | 1972 | 1973 | 1974 |
|---|---|---|---|---|---|
| Wheat | 19 | 5 | 20 | 18 | 10 |
| Rice | 7 | 18 | 4 | 9 | 28 |
In which year the difference between wheat and rice productions is maximum?
12.
Number of children in six families are given below Represent the data on the bar graph
| Families | A | B | C | D | E |
|---|---|---|---|---|---|
| Number of children | 5 | 2 | 7 | 4 | 6 |
Which family has the maximum number of children?
13.
Consider this data collected from a survey of a colony
| Favourite Sport | Cricket | Basket Ball | Swimming | Hockey | Athletics |
|---|---|---|---|---|---|
| Watching | 1240 | 470 | 510 | 430 | 250 |
| participating | 620 | 320 | 320 | 250 | 105 |
Which sport is most popular?
14.
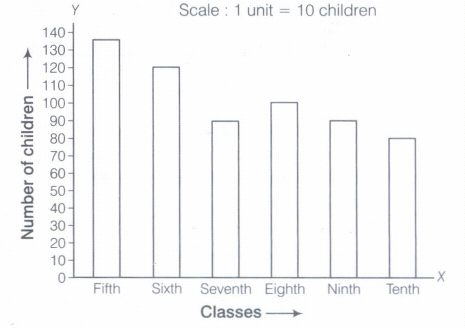
Number of children in six different classes are given below. Represent the data on a bar graph.
| Class | Fifth | Sixth | Seventh | Eighth | ninth | tenth |
|---|---|---|---|---|---|---|
| Number of children | 135 | 120 | 95 | 100 | 90 | 80 |
How would you choose a scale?
15.
Use the bar graph (in the given figure) to answer the following questions.
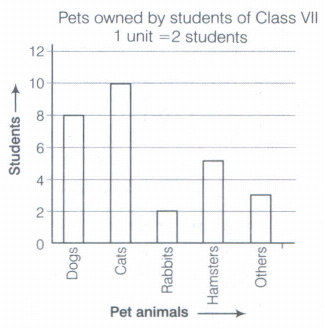
Which is the most popular pet?
16.
Find the mode and median of the following data. 13, 16, 12, 14, 19, 12, 14, 13, 14
17.
The enrolment in a school during six consecutive years was as follows:
1555,1670,1750,2013,2540,2820
Find the mean enrolment of the school for this period
18.
Organise the following marks in a class assessment ,in a tabular form: 4, 6, 7, 5, 3, 5, 4, 5, 2, 6, 2, 5, 1, 9, 6, 5, 8, 4, 6, 7 - Find the arithmetic mean
19.
Organise the following marks in a class assessment,in a tabular form: 4, 6, 7, 5, 3, 5, 4, 5, 2, 6, 2, 5, 1, 9, 6, 5, 8, 4, 6, 7 - Which number is the highest?
20.
How would you find the average of your study hours for the whole week?
1.
Median:
Arranging the given data in ascending order, we have: 110, 110, 120, 120, 120, 120, l30, l30, 140,140.
Number of data = 10, which is an even number.
\(\therefore \)Median = Mean of two middle values
\(\frac { 120+120 }{ 2 } \)=120
Mode: In the given data, we observe that the observation 120 occurs maximum number of times, i.e. 4 times.
\(\therefore \)Mode = 120
2.
(i) If we are collecting the shoe SIze suitable for a particular age, and
(ii) A shopkeeper selling shirts needs to know suitable size to enrich the stock, then mode is more useful.
3.
(a)
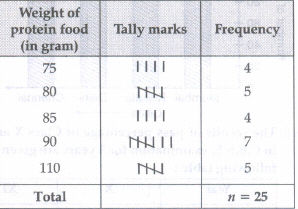
(b) Tabulation of data.
(c) In India, children need sufficient protein food for nutrition.
4.
We have,
\(11=\frac{x+(x+2)+(x+4)+(x+6)+(x+8)}{5}\)
\(\Rightarrow 11=\frac{5x+20}{5}\)
\(\Rightarrow\) 55 = 5x + 20
\(\Rightarrow\) 5x=35
\(\Rightarrow\) x=7
\(\therefore\) Mean of first three observationsv
\(=\frac{x+(x+2)+(x+4)}{3}=\frac{3x+6}{3}\)
=x+2=7+2=9 \([\because x=7]\)
5.
| Marks (x) | No.of students (f) | \(f\times x\) |
| 20 | 12 | 240 |
| 30 | 45 | 1350 |
| 40 | 48 | 1920 |
| 50 | 5 | 250 |
| 60 | 32 | 1920 |
| 70 | 40 | 2800 |
| Total | N=182 | \(\sum f x\)=8480 |
\(Mean=\frac{\sum fx}{N}\)
Putting values from table,
Mean \(=\frac{8480}{182}=46.59.\)
6.
We will have to add atleast three 17's to change the mode to 17. On adding three 17's, the frequency of 17 will be maximum i.e. 4.
7.
(a) We can clearly see that all the 5 letters are vowels i.e. a, e, i, i, u. Hence, it is certain to draw a vowel i.e. probability of drawing a vowel is 1
(b) \(probaility=\frac { number\ ofcards\ marked\ U }{ Total\ numbe\ of\ cards } =\frac { 1 }{ 5 } \)
(c) \(probaility=\frac { number\ of\ cards\ marked\ AorI }{ Total\ number\ of\ cards } =\frac { 2 }{ 5 } \)
(d) \(probaility=\frac { number\ of\ cards\ marked\ with\ a\ consonant }{ Total\ number\ of\ cards } \)
= \(\frac { 0 }{ 5 } \)=0
Hence, it is impossible to draw a consonant
8.
Clearly, from the bar graph, grapes is liked by 4 students. So, the least popular fruit among the students is grapes.
9.
As per the given information,
Total number of trials =100
Number of heads = 59
Number of tails = 100 - 59 = 41
(a) P (getting a head) = \(\frac { number\ of\ heads\ in\ trails }{ Total\ number\ of\ trails } \)
= \(\frac { 59 }{ 100 } \)
(b) P (getting a tail) = \(\frac { number\ of\ heads\ in\ trails }{ Total\ number\ of\ trails } \) = \(\frac { 41 }{ 100 } \)
10.
On the Basic of above table
| Numbers on the die | Frequency |
|---|---|
| 1 | 30 |
| 2 | 43 |
| 3 | 42 |
| 4 | 52 |
| 5 | 38 |
| 6 | 40 |
11.
1972
12.
C
13.
Cricket is most popular sport
14.
We start the scale from o. The greatest value of data is 135, so end the scale at a value greater than 135 such as 140. Use equal division along axes such as increment of 10. Here, we take 1 unit for 10 children.
15.
From the given graph, it is clear that the bar representing cat is the highest i.e. 10.
Therefore, cat is the most popular pet.
16.
(i) On arranging the data in ascending order, we get 12,12,13,13,14,14,14,16,19.
Here, 14 occurs more frequently i. e. 3 times.
\(\therefore\) Mode =14
(ii) Here, ascending order of the given data is 12,12,13,13,14,14,14,16,19
Since, the middle observation of the data = 14
\(\therefore\) Median of data = 14
Hence, mode = 14 and median = 14
17.
Given, the enrolment of a school during six consecutive years
1555,1670,1750,2013,2540,2820
Now, sum of enrolments
= 1555 + 1670 + 1750 + 2013 + 2540 + 2820 = 12348
Number of years = 6
\(\therefore\) Mean enrolment of the school for this period
= \(\frac { sum\quad of\quad enrolments }{ number\quad of\quad years } =\frac { 12348 }{ 6 } =2058\)
Hence, the mean enrolment of the school for this period is 2058.
18.
The frequency table is shwn below.
| Marks | Tally Marks | Number of students (Frequency) |
|---|---|---|
| 1 | I | 1 |
| 2 | II | 2 |
| 3 | I | 1 |
| 4 | III | 3 |
| 5 | IIII | 5 |
| 6 | IIII | 4 |
| 7 | II | 2 |
| 8 | I | 1 |
| 9 | I | 1 |
| Total | 20 |
We have, sum of marks
=4+6+7+5+3+5+4+5+2+6+2+5+1
+ 9 + 6 + 5 + 8 + 4 + 6 + 7 = 100
Number of students = 20
\(\therefore\) Arithmetic mean = \(\frac { sum\ of\ marks }{ number\ of\ students } =\frac { 100 }{ 20 } =5\)
Hence, the arithmetic mean of the data is 5.
19.
The frequency table is shown below.
| Marks | Tally Marks | Number of students (Frequency) |
|---|---|---|
| 1 | I | 1 |
| 2 | II | 2 |
| 3 | I | 1 |
| 4 | III | 3 |
| 5 | IIII | 5 |
| 6 | IIII | 4 |
| 7 | II | 2 |
| 8 | I | 1 |
| 9 | I | 1 |
| Total | 20 |
It is clear from the table that, the highest number = 9
20.
We know that, there are seven days in a week. Let the study hours for different days of the week are as follows
| Days | Hours |
|---|---|
| Monday | 6 h |
| Tuesday | 5 h |
| Wednesday | 6 h |
| Thursday | 7 h |
| Friday | 6 h |
| Saturday | 5 h |
| Sunday | 7 h |
Total number of study hours = 6+5+6+7+6+5+7=42h
Number of days in a week = 7
\(\therefore\) \(Average=\frac { Total\ study\ hours }{ total\ number\ of\ days } =\frac { 42 }{ 7 } =6h\)
Hence, average study hours is 6 h per day

7th Standard CBSE Syllabus & Materials
7th Standard CBSE
CBSE 7th Social Science Theme B - New Beginnings : Cities and States - New Sample Question Papers Study Material - QB365 Set A
NEW7th Standard CBSE
CBSE 7th Social Science Theme A - Climates of India - New Sample Question Papers Study Material - QB365 Set A
NEW7th Standard CBSE
CBSE 7th Social Science Theme A - Geographical Diversity of India - New Sample Question Papers Study Material - QB365 Set A
NEW7th Standard CBSE
CBSE 7th Science Earth, Moon and the Sun - New Sample Question Papers Study Material - QB365 Set A



NCERT Books

Syllabus

Exam Pattern

Sample Question Papers

Previous year Question Papers

Important Notes

MCQ Practice test

NCERT Exemplers

Case study Questions

Image Based Questions

Passage based Questions

HOT Questions

Value Based Questions

Model Questions Papers
NCERT ( Book Back ) Questions

Assertion and Reason
Important Questions And Answers

CBSE 7th Standard CBSE Subjects
CBSE Standards


