
 100% FREE ACCESS
7th Standard CBSE Syllabus & Materials
7th Standard CBSE
CBSE 7th Social Science Theme E - Understanding Market - New Sample Question Papers Study Material - QB365 Set A
NEW7th Standard CBSE
CBSE 7th Social Science Theme E - From Barter to Money - New Sample Question Papers Study Material - QB365 Set A
NEW7th Standard CBSE
CBSE 7th Social Science Theme D - The Constitution of India- An Introduction - New Sample Question Papers Study Material - QB365 Set A
NEW7th Standard CBSE
CBSE 7th Social Science Theme D - From the Rulers to the Ruled : Types of Governments - New Sample Question Papers Study Material - QB365 Set A
NEW7th Standard CBSE
CBSE 7th Social Science Theme B - The Age of Reorganisation - New Sample Question Papers Study Material - QB365 Set A
NEW7th Standard CBSE
CBSE 7th Social Science Theme B - The Rise of Empires - New Sample Question Papers Study Material - QB365 Set A

Published on: 31/10/2025
Download CBSE Class 7th Standard CBSE Mathematics question papers, sample papers, important questions, and previous year solved papers in PDF format. Get free study materials, NCERT solutions, and exam preparation resources for Class 7th Standard CBSE Mathematics
Questions + Answers key
Take MCQ Mathematics Test
1.
Construct or think of five situations, where outcomes do not have equal chances.
2.
Read the bar graph (in the given figure), which shows the number of books sold by a bookstore during five consecutive years and answer the following questions.
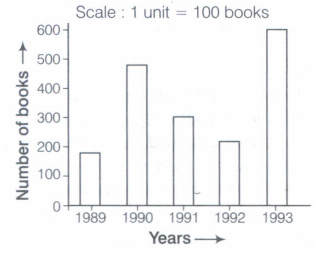
Can you explain how you would estimate the number of books sold in 1989?
3.
Organise the following marks in a class assessment,in a tabular form: 4, 6, 7, 5, 3, 5, 4, 5, 2, 6, 2, 5, 1, 9, 6, 5, 8, 4, 6, 7 - Which number is the lowest
4.
There are 6 marbles in a box with numbers from 1 to 6 marked on each of them -What is the probability of drawing a marble with number 5?
5.
The marks obtained by 10 students in Mathematics are given below: ; :10,20,13,49, 50, 10, 29, 37, 0,5 - Find the range
6.
Find the mode of 2, 14, 16, 12, 14, 14, 16, 14, 10, 14, 18, 14
7.
The heights of 10 girls were measured (in cm) and the results are as follows: 135, 150,139, 128, 151, 132, 146, 149, 143, 141 - What is the height of the shortest girl?
8.
The mean of three numbers is 20 and the mean of other four numbers is 26. Find the mean of all the numbers.
9.
Age (in years) of 6 children of two groups are recorded as below
| Age(in years) | |
|---|---|
| Group A | Gropu B |
| 7 | 7 |
| 7 | 9 |
| 9 | 11 |
| 8 | 12 |
| 10 | 12 |
| 10 | 12 |
(a) Find the mode and range for each group.
(b) Find the range and mode, if the two groups are combined together
10.
The mean of 10 observations was calculated as 40. It was detected on rechecking that the value of 45 was wrongly copied as 15. Find the correct mean.
11.
Think of some situations, at least 3 examples of each, that are certain to happen, some that are impossible and some that may or may not happen i.e. situations that have some chance of happening.
12.
A bag is having 4 red balls and 6 yellow balls. If a ball is pulled out without seeing them, then find the probability of getting a red ball.
\(\frac { 2 }{ 5 } \)
\(\frac { 3 }{ 5 } \)
\(\frac { 9 }{ 12 } \)
\(\frac { 2 }{ 3 } \)
13.
Khilona earned scores of 97,73 and 88, respectively in her first three examinations. If she scored 80 in the fourth examination, then her average score will be
increased by 1
increased by 1.5
decreased by 1
decreased by 1.5
14.
Which measures of central tendency get affected, if the extreme observations on both the ends of a data a arranged in descending order are removed?
Mean and mode
Mean and median
Mode and median
Mean, median and mode
15.
The median of the data 2, 16, 29, 88, 49, 99,16,4,37 is
16
29
99
88
16.
The mode of the data 22,29, 27, 23, 43, 41, 27 is
23 and 27
27
23 and 43
22
17.
.......can be used to compare two collections of data
18.
When a die is thrown the probability of getting a number less than 3 is......................
19.
The representation of data with bars of uniform width is called _____
20.
The median of data 18, 14, 24, 29, 27 is.........
21.
The median of any data lies between the ... and ... observations.
1.
In the following situations, the outcomes do not have equal chance:
(i) In drawing a red marble from a box having 3 red marbles and 5 white marbles.
(ii) In drawing a black ball from a box having 6 black balls and 4 yellow balls.
(iii) Choosing an odd number from first 11 natural numbers.
(iv) Choosing a girl as class monitor from a group of 10 girls and 15 boys.
(v) In drawing a red ace card from a well shuffled pack of 52 cards
2.
From the bar graph, it is clear that number of books in the years 1989 is 180 (approx.). We can see in the bar graph that the number of book sold in the year 1989 is little less than 200, but greater than 175.
3.
The frequency table is shwn below.
| Marks | Tally Marks | Number of students (Frequency) |
|---|---|---|
| 1 | I | 1 |
| 2 | II | 2 |
| 3 | I | 1 |
| 4 | III | 3 |
| 5 | IIII | 5 |
| 6 | IIII | 4 |
| 7 | II | 2 |
| 8 | I | 1 |
| 9 | I | 1 |
| Total | 20 |
It is dear from the table that, the lowest number = 1
4.
Out of 6 marbles, one can be drawn in 6 ways
\(\therefore\) Total number of possible outcomes = 6
A probability of drawing marble with number 5, P(5) = \(\frac{1}{6}\)
5.
5
6.
We have, 2, 14, 16, 12, 14, 14, 16, 14, 10, 14, 18, 14
On arranging the data in ascending order, we get 2,10,12,14,14,14,14,14,14,16,16,18 Now, we will arrange it in a table form
| Numbers | Occuring time (frequency) |
|---|---|
| 2 | One time |
| 10 | One time |
| 12 | One time |
| 14 | Six times |
| 16 | Two times |
| 18 | One times |
Since, 14 occurs the maximum number of times i.e. 6. Hence, mode of the data is 14.
7.
On arranging the data in ascending order, we get 128,132,135,139,141,143,146,149,150,151 From ascending order of hights, we observe that first term is minimum.
\(\therefore\) A height of the shortest girl = 128 cm
8.
23.42
9.
From the given table, age of children in group A
=7yr,7yr,9yr,8yr, 10yr, 10yr
Age of children in group 8
= 7yr , 9yr, 11 yr, 12yr, 12yr, 12yr
(a) Mode in group A = 7 yr and 10 yr
( \(\because\) 7 y rand 10 yr occurs 2 times)
Range in group A = Maximum value - Minimum value
=10-7=3
Mode in group 8= 12 yr
Range in group 8=12 -7 = 5
(b) If both groups are combined together 7, 7, 7, 9, 9,11,8, 12, 10, 12, 10, 12
Mode = 7 and 12 [\(\because\) 7 and 12 occurs 3 times]
Range = Maximum value - Minimum value
=12-7=5
10.
As per the given information, mean of 10 observations is 40.
\(\therefore\) Mean \(=\frac { sum\ of\ all\ observations }{ number\ of\ observations } \)
\(\Rightarrow\) 40 = \(\frac { sum\ of\ all\ observations }{ 10 } \)
Sum of all observations = 40 x 10 = 400
But this is incorrect sum. Since, one observation was copied wrongly.
Correct sum = Incorrect sum - Incorrect observation + Correct observation
= 400 - 15 + 45 = 430
correct mean \(=\frac { Correct\ sum }{ number\ of\ observations } =\frac { 430 }{ 10 } =43\)
11.
(a) Possible situations to happen are as follows:
(i) On tossing a coin, getting either a head or a tail
(ii) On drawing one card from a pack of 52 cards one side will appear.
(iii) Getting a number from 1 to 6 by throwing a die.
(b) Impossible to happen are as follows:
(i) A girl in the boy's school.
(ii) Getting a number 8 by throwing a die.
(iii) A person of height 3 m.
(c) Mayor may not happen situations are as follows:
(i) To toss a coin and get tail.
(ii) Probably it may rain.
(iii) An ant rising to 4 m height
12.
(a)
\(\frac { 2 }{ 5 } \)
13.
(d)
decreased by 1.5
14.
(a)
Mean and mode
15.
(b)
29
16.
(b)
27
17.
A double bar graph can be used to compare two collections of data.
18.
number less than 3 are 1 and 2
p (getting a number less thn 3) = \(\frac { 2 }{ 6 } =\frac { 1 }{ 3 } \)
19.
The representation of data with bars of uniform width is called bar graph
20.
For median, arrangement of given data in ascending order
14,18,24,27,29
\(\therefore\) Median = middle number in data = 24
21.
\(\underset { \overset { \downarrow }{ minimum\quad value } }{ 1 } ,2,4,\underset { \overset { \downarrow }{ median } }{ 6 } ,8,9,\underset { \overset { \downarrow }{ maximum\quad value } }{ 11 } \)

7th Standard CBSE Syllabus & Materials
7th Standard CBSE
CBSE 7th Social Science Theme B - New Beginnings : Cities and States - New Sample Question Papers Study Material - QB365 Set A
NEW7th Standard CBSE
CBSE 7th Social Science Theme A - Climates of India - New Sample Question Papers Study Material - QB365 Set A
NEW7th Standard CBSE
CBSE 7th Social Science Theme A - Geographical Diversity of India - New Sample Question Papers Study Material - QB365 Set A
NEW7th Standard CBSE
CBSE 7th Science Earth, Moon and the Sun - New Sample Question Papers Study Material - QB365 Set A



NCERT Books

Syllabus

Exam Pattern

Sample Question Papers

Previous year Question Papers

Important Notes

MCQ Practice test

NCERT Exemplers

Case study Questions

Image Based Questions

Passage based Questions

HOT Questions

Value Based Questions

Model Questions Papers
NCERT ( Book Back ) Questions

Assertion and Reason
Important Questions And Answers

CBSE 7th Standard CBSE Subjects
CBSE Standards


