
 100% FREE ACCESS
7th Standard CBSE Syllabus & Materials
7th Standard CBSE
CBSE 7th Social Science Theme E - Understanding Market - New Sample Question Papers Study Material - QB365 Set A
NEW7th Standard CBSE
CBSE 7th Social Science Theme E - From Barter to Money - New Sample Question Papers Study Material - QB365 Set A
NEW7th Standard CBSE
CBSE 7th Social Science Theme D - The Constitution of India- An Introduction - New Sample Question Papers Study Material - QB365 Set A
NEW7th Standard CBSE
CBSE 7th Social Science Theme D - From the Rulers to the Ruled : Types of Governments - New Sample Question Papers Study Material - QB365 Set A
NEW7th Standard CBSE
CBSE 7th Social Science Theme B - The Age of Reorganisation - New Sample Question Papers Study Material - QB365 Set A
NEW7th Standard CBSE
CBSE 7th Social Science Theme B - The Rise of Empires - New Sample Question Papers Study Material - QB365 Set A

Published on: 31/10/2025
Download CBSE Class 7th Standard CBSE Mathematics question papers, sample papers, important questions, and previous year solved papers in PDF format. Get free study materials, NCERT solutions, and exam preparation resources for Class 7th Standard CBSE Mathematics
Questions + Answers key
Take MCQ Mathematics Test
1.
The cards bearing letter of the word "MATHEMATICS" are placed in a bag. A card is taken out from the bag without looking into the bag (at random).
(a) How many outcomes are possible when a letter is taken out of the bag at random?
(b) What is the probability of getting:
(i) M?
(ii) Any vowel?
(iii) Any consonant?
(iv) X?
2.
The results of pass percentage of Class X and XII in C.B.S.E.examination for 5 years are given in the following table:
| year | X | XI |
| 1994-95 | 90 | 95 |
| 1995-96 | 95 | 80 |
| 1996-97 | 90 | 85 |
| 1997-98 | 80 | 90 |
| 1998-99 | 98 | 95 |
Draw bar graphs to represent the data.
3.
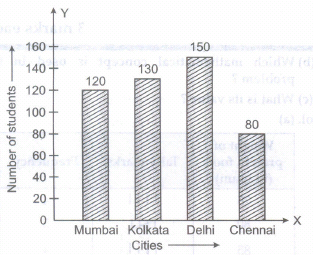
The population of four major cities in India in a particular year is given below:
| City | Mumbai | Kolkata | Delhi | Chennai |
| Number of students | 120 | 130 | 150 | 80 |
Construct a bar graph to represent the above data.
4.
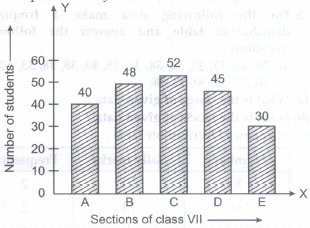
In a school, there are five sections of class VII. The number of students in each section is given below. Construct a bar graph representing this data:
| Section | A | B | C | D | E |
| Number of students | 40 | 48 | 52 | 45 | 30 |
5.
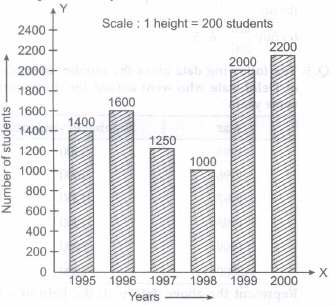
The following data gives the number of students of Delhi state who went abroad for study during some years :
| Year | Number of students |
| 1995 | 1400 |
| 1996 | 1600 |
| 1997 | 1250 |
| 1998 | 1000 |
| 1999 | 2000 |
| 2000 | 2200 |
Represent the above data with the help of a bar graph.
6.
The mean marks of seven students are 55. The marks of 6 students are 52, 54, 55, 53, 56 and 54. Find the marks of seventh student
7.
The mean of four numbers is 32. If one more number is added to the collection, the new average of the five numbers becomes 31. find the mean value of fifth observation
8.
The following are weights (in kg) of 12 people. 70,62,54,57,62,84,75,59,62,65,78,60
(a) Find the mean of the weights of the people.
(b) How many people weigh above the mean weight?
(c) Find the range of the given data
9.
Rahul scored of 97,73 and 80, respectively in his first three examinations. If he scored 70 in the fourth examination, then find how much average score increased/decreased.
10.
The mean of 10 observations was calculated as 40. It was detected on rechecking that the value of 45 was wrongly copied as 15. Find the correct mean.
1.
(a) There are 11 outcomes namely M, M, A, A, T, T, H, E,I, C, S.
(b) (i) Probability of getting \('M'=\frac{2}{11}\)
(ii) Probability of getting a vowel \(=\frac{4}{11}\)
(iii) Probability of getting a consonant \(=\frac{7}{11}\)
(iv) Probability of getting \(X=0=\frac{0}{11}\)
2.
We go through the following steps to construct the bar graphs:
(a) We draw two lines perpendicular to each other on a graph paper and call them horizontal and vertical axes as shown in Fig. below :
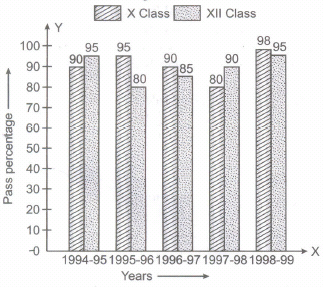
(b) Along the horizontal axis, we mark the 'years' and along the vertical axis, we mark the 'pass percentage.
(c) We choose a suitable scale to determine the heights of bars. Here, we choose the scale as 1 big division to represent 10.
(d) First we draw the bars for Class X results and then bars for Class XII results for different years.
Bars for X and XII class results are shaded separately and the shading is shown in the top right comer of the graph paper.
3.
To construct the bar graph representing the given data, we follow the following steps:
(a) We take a graph paper and draw two mutually perpendicular lines OX and OY.
(b) Along the horizontal line OX, we mark 'cities' and along the vertical line, we mark the 'population'.
(c) Along the axis OX, we choose equal suitable width of each bar. The gap between the bars is chosen same.
(d) Choose a suitable scale to determine the heights of the bars, according to the availability of space.
Here, we choose 1 big division to represent 20 lakh population.
(e) Calculate the height of various bars as follows:
The height of the bar for Mumbai \(=\frac{120}{20}=\) 6 big divisions
The height of the bar for Kolkata \(=\frac{130}{20}=\) 6.5 big divisions
The height of the bar for Delhi \(=\frac{150}{20}=\) 7.5 big divisions
The height of the bar for Chennai \(=\frac{80}{20}=\) 4 big divisions
(f) Now, we draw the bars as shown in Fig. below and at the top of each bar we write the population of the corresponding city.
4.
We go through the following steps to construct the bar graph:
(a)Take a graph paper and draw two lines OX and OY perpendicular to each other. Call the horizontal line as OX and the vertical line as OY.
(b) Along the horizontal axis OX, mark "sections of Class VII" and along the vertical axis OYmark "No. of students".
(c) Along the horizontal axis OX, choose the uniform (equal) width of the bars and the uniform gap between them.
(d) Choose a suitable scale to determine the heights of the bars, according to the space available for the graph. Here, we choose 1 small division to represent 1 student.
(e) Calculate the heights of the various bars as follows:
Height of the bar for section A = 40 x 1
= 40 small divisions = 4 big divisions
Height of the bar for Section B = 48 x 1
= 48 small divisions
= 4 big divisions and 8 small divisions
Height of the bar for Section C = 52 x 1
= 52 small divisions
= 5 big divisions and 2 small divisions
Height of the bar for Section D = 45 small divisions
= 4 big divisions and 5 small divisions.
Height of the bar for Section E = 30 small divisions
= 3 big divisions.
(f) We draw the bars as shown in Fig. below and on the top of each bar, we write the number of students represented by it.
5.
In order to construct a bar graph representing the above data. We follow the following steps:
(a) Take a graph paper and draw two mutually perpendicular lines OX and OY as shown in Fig. Call OX as the horizontal axis and OY as the vertical axis.
(b) Along OX, mark years and along OY, mark number of students.
(c) Along OX, choose the uniform (equal) width of the bars and the uniform gap between them, according to the space available for the graph.
(d) Choose a suitable scale to determine the heights of the bars, according to the availability of space. Here, we choose 1 big division to represent 200 students.
(e) Calculate the height of various bars as follows: The height of the bar for the year 1995 is equal to
\(\frac{1400}{200}=7\) big divisions;
The height of the bar for the year 1996 \(=\frac{1600}{200}\ \)big divisions
The height of the bar for the year 1997 \(=\frac{1250}{200}\)big divisions
= 6 big divisions and 2.5 small divisions
The height of the bar for the year 1998 \(=\frac{1000}{200}\)5 big divisions
The height of the bar for the year 1999 \(=\frac{2000}{200}\)10 big divisions
The height of the bar for the year 2000 \(=\frac{2200}{200}\)11 big divisions
(f) We draw the bars as shown in Fig. below and on the top of each bar we write the number of students represented by it.
6.
61
7.
27
8.
The weights of 12 people are 70, 62, 54, 57, 62,
84, 75, 59, 62, 65, 78 and 60.
Sum of weights of 12 people
= 70 + 62 + 54 + 57 + 62 + 84 + 75 + 59 + 62 + 65 + 78 + 60 = 788
\(\therefore\) Mean = \(\frac { sum\quad of\quad observations }{ number\quad of\quad observations } \)
= \(\frac { 788 }{ 12 } =65.66\)
(b) Weights above 65.66 are 70,84,75 and 78, i.e. 4 people.
(c) Range = Maximum value - Minimum value
= 84 - 54 = 30
9.
Since, Rahul's scores in three examinations are 97, 73 and 80.
Sum of three scores = 97 + 73 + 80 = 25
Average of three Scores = \(\frac { 250 }{ 3 } =83.33\)
If score in fourth examination is 70, then average
will be = \(\frac { 250+70 }{ 4 } =\frac { 320 }{ 4 } =80\)
Hence, average score decreases by
83.33 - 80 = 3.33
10.
As per the given information, mean of 10 observations is 40.
\(\therefore\) Mean \(=\frac { sum\ of\ all\ observations }{ number\ of\ observations } \)
\(\Rightarrow\) 40 = \(\frac { sum\ of\ all\ observations }{ 10 } \)
Sum of all observations = 40 x 10 = 400
But this is incorrect sum. Since, one observation was copied wrongly.
Correct sum = Incorrect sum - Incorrect observation + Correct observation
= 400 - 15 + 45 = 430
correct mean \(=\frac { Correct\ sum }{ number\ of\ observations } =\frac { 430 }{ 10 } =43\)

7th Standard CBSE Syllabus & Materials
7th Standard CBSE
CBSE 7th Social Science Theme B - New Beginnings : Cities and States - New Sample Question Papers Study Material - QB365 Set A
NEW7th Standard CBSE
CBSE 7th Social Science Theme A - Climates of India - New Sample Question Papers Study Material - QB365 Set A
NEW7th Standard CBSE
CBSE 7th Social Science Theme A - Geographical Diversity of India - New Sample Question Papers Study Material - QB365 Set A
NEW7th Standard CBSE
CBSE 7th Science Earth, Moon and the Sun - New Sample Question Papers Study Material - QB365 Set A



NCERT Books

Syllabus

Exam Pattern

Sample Question Papers

Previous year Question Papers

Important Notes

MCQ Practice test

NCERT Exemplers

Case study Questions

Image Based Questions

Passage based Questions

HOT Questions

Value Based Questions

Model Questions Papers
NCERT ( Book Back ) Questions

Assertion and Reason
Important Questions And Answers

CBSE 7th Standard CBSE Subjects
CBSE Standards


