
 100% FREE ACCESS
7th Standard CBSE Syllabus & Materials
7th Standard CBSE
CBSE 7th Social Science Theme E - Understanding Market - New Sample Question Papers Study Material - QB365 Set A
NEW7th Standard CBSE
CBSE 7th Social Science Theme E - From Barter to Money - New Sample Question Papers Study Material - QB365 Set A
NEW7th Standard CBSE
CBSE 7th Social Science Theme D - The Constitution of India- An Introduction - New Sample Question Papers Study Material - QB365 Set A
NEW7th Standard CBSE
CBSE 7th Social Science Theme D - From the Rulers to the Ruled : Types of Governments - New Sample Question Papers Study Material - QB365 Set A
NEW7th Standard CBSE
CBSE 7th Social Science Theme B - The Age of Reorganisation - New Sample Question Papers Study Material - QB365 Set A
NEW7th Standard CBSE
CBSE 7th Social Science Theme B - The Rise of Empires - New Sample Question Papers Study Material - QB365 Set A

Published on: 31/10/2025
Download CBSE Class 7th Standard CBSE Mathematics question papers, sample papers, important questions, and previous year solved papers in PDF format. Get free study materials, NCERT solutions, and exam preparation resources for Class 7th Standard CBSE Mathematics
Questions + Answers key
Take MCQ Mathematics Test
1.
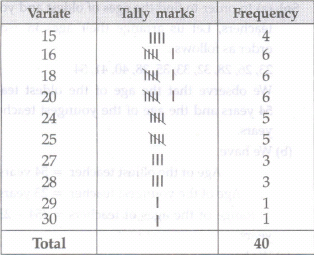
Form a discrete frequency distribution from the following scores :
15, 18, 16, 20, 25, 24, 25, 20, 16, 15, 18, 18, 16 24, 15, 20, 28, 30, 27, 16, 24, 25, 20, 18, 28, 27 25,24,24,18,18,25,20,16,15,20,27,28,29,16
2.
If the arithmetic mean of 6, 8, 5, 7, P and 4 is 7, then find the value of p.
3.
The marks (out of 100) obtained by a group of students in a Science test are 85, 76, 90, 85, 39, 48, 56,95,81 and 75. mean marks obtained by the group
4.
Weight (in kg) atleast 20 children (girls and boys) of your class. Organise the data and answer the following questions using this data. What is the most common weight?
5.
(a) What is the mean of first four counting numbers?
(b) What is mode of 3,1,2,3,4,3,5,3, 1, 6, 3, 9, 3?
(c) What is mean of 98, 99, 100, 0, 1 and 2?
6.
Following table shows the points of each player scored in four games
| Players | Game | Game | Game | Game |
|---|---|---|---|---|
| 1 | 2 | 3 | 4 | |
| A | 14 | 16 | 10 | 10 |
| B | 0 | 8 | 6 | 4 |
| C | 8 | 11 | Did not play | 13 |
Who is the best performer?
7.
Organise the following marks in a class assessment ,in a tabular form: 4, 6, 7, 5, 3, 5, 4, 5, 2, 6, 2, 5, 1, 9, 6, 5, 8, 4, 6, 7 - What is the range of the data?
8.
Organise the following marks in a class assessment,in a tabular form: 4, 6, 7, 5, 3, 5, 4, 5, 2, 6, 2, 5, 1, 9, 6, 5, 8, 4, 6, 7 - Which number is the highest?
9.
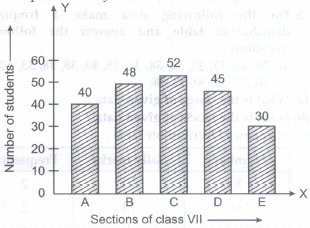
In a school, there are five sections of class VII. The number of students in each section is given below. Construct a bar graph representing this data:
| Section | A | B | C | D | E |
| Number of students | 40 | 48 | 52 | 45 | 30 |
10.
The bar graph in figure shows the result of a survey to test water resistant watches made by different companies. Each of these companies claimed that their watches were water resistant. After a test, the above results were revealed.
(a) Can you work out a fraction of the number of watches that leaked to the number tested for each company?
(b) Could you tell on this basis which company has better watches?
11.
The data 12, 13, 14, 15, 16, has every observation as mode.
12.
Mean of the data is always from the given data.
13.
Mean, Median and Mode may be the same for some data.
14.
The value of x is 4 in the data 16, 8, 2, 6, x, 0, 4, 6, where mean is 5.
15.
The mean of the data 20, 40, 60, 80, 70 is 55.
16.
In a given data arranged in an order, the median is the value of the
17.
The arithmetic mean is
18.
The probability of an event that may happen
19.
Mode
20.
Range
21.
The probability of an event which is impossible to happen is__________
22.
.......can be used to compare two collections of data
23.
When a die is thrown, the probability of getting a number less than 7 is _____
24.
If 12 observation's mean is 6. Then, the sum of 12 observations is....................
25.
The mode of the following data 62,61,49,37, 91,61,47, 53, 54, 97, 98, 99 is
26.
An unbiased die is tossed once. Which of the following is the probability of getting an even number?
1
\(\frac{1}{2}\)
\(\frac{1}{3}\)
\(\frac{1}{4}\)
27.
Which of the following is the mode of the data 1, 1, 2, 4, 3, 2, 1, 2, 2, 4?
1
2
3
4
28.
The money saved by a student during first six days of a week are Rs. 46, Rs. 24, Rs 29, Rs 27, Rs. 4 and Rs 42. Find the average saving per day.
42
39
35
36
29.
The runs scored in a cricket match by 11 players are as follows: 6, 15, 120, 50, 100, 80, 10, 15, 8, 10, 10. Find the median of scores.
46
8
15
120
30.
The median of the data 2, 16, 29, 88, 49, 99,16,4,37 is
16
29
99
88
31.
What is the mean of 98, 99, 100, 0, 1 and 2?
32.
What is the mean of first six single digit counting numbers?
33.
What is the mean of first four counting numbers?
34.
The mean marks (out of 100) of a group of students is 60. If their marks are 85, 62, 36, 48, 72, x, 75 and 39, then find the value of x.
1.
Frequency distribution of scores:
2.
p = 12
3.
Given, marks obtained by a group of students in a Science test
85,76,90,85,39,48,56,95,81,75
On rearranging the marks in ascending order, we get
39,48,56,75,76,81,85,85,90,95
We have, total marks
= 39 + 48 + 56 + 75 + 76 + 81 + 85 + 85 + 90 +95
= 730
Number of students = 10
\(\therefore\) mean = \(\frac { total\ marks\ obtained\ by\ group }{ number\ of\ students } \)
= \(\frac { 730 }{ 10 } =73\)
Hence, mean marks obtained by the group is 73.
4.
Let the weight (in kg) of 20 children of your classare as follows:
35, 35, 40, 33, 36, 40, 50, 38, 45, 34,
40, 40, 37, 34, 32, 48, 42, 35, 36, 40
Now, arranging the weight of 20 children of your class in descending order, we have
50, 48, 45, 42, 40, 40, 40, 40, 40, 38
37, 36, 36, 35, 35, 35, 34, 34, 33, 32
The most common weight is 40 kg, because five children have 40 kg weight.
5.
(a) First four counting numbers are 1,2,3,4
\(\Rightarrow Mean=\frac{1+2+3+4}{4}\)
\(=\frac{10}{4}=2.5\)
(b) Arranging the numbers with same values together, we get
1,1,2,3,3,3,3,3,3,4,5,6,9
In this data maximum frequency is of 3 which is 6.
\(\therefore\) mode is 3
(c) \(Mean=\frac{98+99+100+0+1+2}{6}\)
\(=\frac{300}{6}=50.\)
6.
Average number of points scared by A = 12.5 [as calculated in part (i)]
Average number of points scared by B = 4.5 [as calculated in part (iii)]
\(=\frac { sum\ of\ points\ in\ games }{ number\ of\ games } \)
= \(\frac { 8+11+13 }{ 3 } =\frac { 32 }{ 3 } \) =10.67
\(\because\) 12.5 > 10.67 > 4.5
Hence, A is the best performer.
7.
The frequency table is shwn below.
| Marks | Tally Marks | Number of students (Frequency) |
|---|---|---|
| 1 | I | 1 |
| 2 | II | 2 |
| 3 | I | 1 |
| 4 | III | 3 |
| 5 | IIII | 5 |
| 6 | IIII | 4 |
| 7 | II | 2 |
| 8 | I | 1 |
| 9 | I | 1 |
| Total | 20 |
From the above frequency table,
Highest number = 9
Lowest number = 1
\(\therefore\) A range of data = Highest number - Lowest number
=9-1=8
Hence, the range of the data is 8.
8.
The frequency table is shown below.
| Marks | Tally Marks | Number of students (Frequency) |
|---|---|---|
| 1 | I | 1 |
| 2 | II | 2 |
| 3 | I | 1 |
| 4 | III | 3 |
| 5 | IIII | 5 |
| 6 | IIII | 4 |
| 7 | II | 2 |
| 8 | I | 1 |
| 9 | I | 1 |
| Total | 20 |
It is clear from the table that, the highest number = 9
9.
We go through the following steps to construct the bar graph:
(a)Take a graph paper and draw two lines OX and OY perpendicular to each other. Call the horizontal line as OX and the vertical line as OY.
(b) Along the horizontal axis OX, mark "sections of Class VII" and along the vertical axis OYmark "No. of students".
(c) Along the horizontal axis OX, choose the uniform (equal) width of the bars and the uniform gap between them.
(d) Choose a suitable scale to determine the heights of the bars, according to the space available for the graph. Here, we choose 1 small division to represent 1 student.
(e) Calculate the heights of the various bars as follows:
Height of the bar for section A = 40 x 1
= 40 small divisions = 4 big divisions
Height of the bar for Section B = 48 x 1
= 48 small divisions
= 4 big divisions and 8 small divisions
Height of the bar for Section C = 52 x 1
= 52 small divisions
= 5 big divisions and 2 small divisions
Height of the bar for Section D = 45 small divisions
= 4 big divisions and 5 small divisions.
Height of the bar for Section E = 30 small divisions
= 3 big divisions.
(f) We draw the bars as shown in Fig. below and on the top of each bar, we write the number of students represented by it.
10.
.png)
(a) For company A Number of tested watches=40
Number of leaked watches = 20
Now, required fraction = \(\frac { Leaked\quad watches }{ Tested\quad watches } =\frac { 20 }{ 40 } =\frac { 1 }{ 2 } \) [dividing numerator and denominator by 10]
For company B Number of tested watches = 40
Number of leaked watches = 10
Required fraction = \(\frac { 10 }{ 40 } =\frac { 1 }{ 4 } \) [dividing numerator and denominator by 10]
For company C Number of tested watches = 40
Number of leaked watches = 15
Required fraction = \(\frac { 15 }{ 40 } =\frac { 3 }{ 8 } \) [dividing numerator and denominator by 5]For company D Number of tested watches = 40
Number of leaked watches = 25
Required fraction = \(\quad \frac { 25 }{ 40 } =\frac { 5 }{ 8 } \) [dividing numerator and denominator by 5]
(b) From above discussion, it is clear that company B has better watches, because company B has least fraction of the number of watches that leaked to the number of watches that were tested.
11.
(a)
12.
(b)
13.
(a)
14.
(b)
15.
(b)
16.
()
middle most term
17.
()
\(\frac { sum\ of\ all\ observation }{ the\ total\ number\ of\ observation } \)
18.
()
can lie between 0 and l
19.
()
Highest frequency
20.
()
Highest observation - Lowest observation
21.
()
0
22.
A double bar graph can be used to compare two collections of data.
23.
We know that on a die, there are six faces with numbers from 1 to 6. Clearly, all the numbers are less than 7. Hence, whatever number appears on throwing a die, it will be less than 7. In other words, we can say that it is certain to get a number less than 7 on throwing a die. Hence, its probability is 1
24.
\(Mean= \frac { sum\ of\ observations }{ number\ of\ observatins } \)
\(6=\frac { sum\ of\ observations }{ 12 } \)
Sum of observations = 12 x 6 = 72
25.
Mode = maximum occuring observation = 67 (occurs 2 times)
26.
(b)
\(\frac{1}{2}\)
27.
(b)
2
28.
29.
(c)
15
30.
(b)
29
31.
()
50
32.
()
3.5
33.
()
\(\frac{1+2+3+4}{4}=2.5\)
34.
Total number of students = 8
Sum of the marks obtained =85 + 62 + 36 + 48 + x + 75 + 39 + 72=417+x
\(\therefore \)Mean marks =\(\frac { (417\quad +x) }{ 8 } \)
\(\Rightarrow \)\(\frac { (417\quad +x) }{ 8 } \)=60
\(\Rightarrow \)417 + x = 60 x 8 = 480
\(\Rightarrow \)x = 480 - 417 = 63
Thus, the required value of x = 63

7th Standard CBSE Syllabus & Materials
7th Standard CBSE
CBSE 7th Social Science Theme B - New Beginnings : Cities and States - New Sample Question Papers Study Material - QB365 Set A
NEW7th Standard CBSE
CBSE 7th Social Science Theme A - Climates of India - New Sample Question Papers Study Material - QB365 Set A
NEW7th Standard CBSE
CBSE 7th Social Science Theme A - Geographical Diversity of India - New Sample Question Papers Study Material - QB365 Set A
NEW7th Standard CBSE
CBSE 7th Science Earth, Moon and the Sun - New Sample Question Papers Study Material - QB365 Set A



NCERT Books

Syllabus

Exam Pattern

Sample Question Papers

Previous year Question Papers

Important Notes

MCQ Practice test

NCERT Exemplers

Case study Questions

Image Based Questions

Passage based Questions

HOT Questions

Value Based Questions

Model Questions Papers
NCERT ( Book Back ) Questions

Assertion and Reason
Important Questions And Answers

CBSE 7th Standard CBSE Subjects
CBSE Standards


