
 100% FREE ACCESS
7th Standard CBSE Syllabus & Materials
7th Standard CBSE
CBSE 7th Social Science Theme E - Understanding Market - New Sample Question Papers Study Material - QB365 Set A
NEW7th Standard CBSE
CBSE 7th Social Science Theme E - From Barter to Money - New Sample Question Papers Study Material - QB365 Set A
NEW7th Standard CBSE
CBSE 7th Social Science Theme D - The Constitution of India- An Introduction - New Sample Question Papers Study Material - QB365 Set A
NEW7th Standard CBSE
CBSE 7th Social Science Theme D - From the Rulers to the Ruled : Types of Governments - New Sample Question Papers Study Material - QB365 Set A
NEW7th Standard CBSE
CBSE 7th Social Science Theme B - The Age of Reorganisation - New Sample Question Papers Study Material - QB365 Set A
NEW7th Standard CBSE
CBSE 7th Social Science Theme B - The Rise of Empires - New Sample Question Papers Study Material - QB365 Set A

Published on: 31/10/2025
Download CBSE Class 7th Standard CBSE Mathematics question papers, sample papers, important questions, and previous year solved papers in PDF format. Get free study materials, NCERT solutions, and exam preparation resources for Class 7th Standard CBSE Mathematics
Questions + Answers key
Take MCQ Mathematics Test
1.
Find the product of \(\frac { 6 }{ 3 } \)and \(\frac { 1 }{ 4 } \)
2.
Find (-31) x (-100)
3.
Arrange the following in descending order \(\frac{1}{5},\frac{3}{7},\frac{7}{10}\)
4.
Solve (-21) - (30)
5.
Solve (-6) - (-16)
6.
Solve 14- (-20)
7.
Solve 10 + (-4)
8.
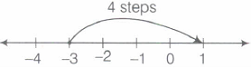
Add the following integers using number line: -3 and 4
9.
Find the mode of the following data.1 , 4, 6, 5, 6, 2, 3, 4, 5, 3, 2, 4, 5, 2, 3
10.
Verify a + (b + c) = (a + b) + C for the following values of a, b and c. a =18, b = 15, c = 13.
11.
Write 5 rational numbers between \(\frac { 1 }{ 3 } \) and \(\frac { 1 }{ 4 } \).
12.
The bar graph given below shows the marks of students of a class in a particular subject
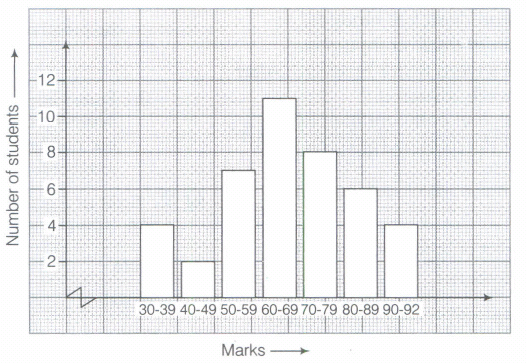
If 40 is the pass mark, then how many students have failed?
13.
Find the mode of the following data - 12,14,12,16,15,13,14,18,19,12,14,15,16,15, 16, 16, 15, 17, 13, 16, 16, 15, 15, 13, 15, 17, 15, 14, 15,13,15,14
14.
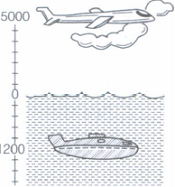
A plane is flying at the height of 5000 m above the sea level. At a particular point, it is exactly above a submarine floating 1200m below the sea level. What is the vertical distance between them?
15.
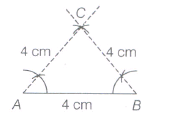
In the given figure, AB = AC = BC, then the value of each angle is equal to
40°
70°
90°
60°
16.
The value of (-2) x (-1) x (1) is
1
3
-4
2
17.
The number of trees in different parks of a city are 33, 38, 48, 33, 34, 34, 33 and 24. The mode of this data is
24
34
33
48
18.
The mode of the data 22,29, 27, 23, 43, 41, 27 is
23 and 27
27
23 and 43
22
19.
How many rational numbers are there between two rational numbers?
2
0
unlimited
100
20.
In a right triangle, the longest side is called ______________.
21.
The representation of data with bars of uniform width is called _____
22.
(- 206) \(\div\) ____ = 1
23.
Replace the blank with an integer to make it a true statement. (-3) x _____ =27
24.
\(\frac { -2 }{ 9 } -\frac { 7 }{ 9 } =\_ \_ \_ \_ \_ \_ \)
25.
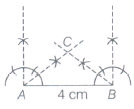
\(\angle A=45^0,\angle B=45^0,\)AB= 4 cm
26.
\(7 \frac{5}{6}\times \frac{3}{47} \times46\)
27.
(60) \(\div\) 1
28.
Range
29.
\(\frac { b }{ a } \div \left( \frac { d }{ c } \right) \)
30.
Draw \(\triangle PQR\) with PQ= 4 cm, QR = 3.5 cm and PR = 4 cm. What type of triangle is this?
31.
Look at the following table and fill up the blank spaces.
| Hundreds (100) | Tens (10) | Ones (1) | Tenths (\(\frac{1}{10}\)) | Hundredths (\(\frac{1}{100}\)) |
Thousandths (\(\frac{1}{1000}\)) | Number |
|---|---|---|---|---|---|---|
| 2 | 5 | 3 | 1 | 4 | 7 | 253.147 |
| 6 | 2 | 9 | 3 | 2 | 1 | _______ |
| 0 | 4 | 3 | 1 | 9 | 2 | _______ |
| _____ | 1 | 4 | 2 | 5 | 1 | 514.251 |
| 2 | ______ | 6 | 5 | 1 | 2 | 236.512 |
| _____ | 2 | ______ | 5 | _______ | 3 | 724.503 |
| 6 | ______ | 4 | _______ | 2 | ________ | 614.326 |
| 0 | 1 | 0 | 5 | 3 | 0 | ______ |
32.
Study the double bar graph given below and answer the questions that follow:
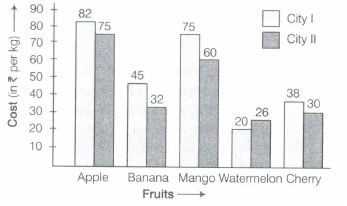
(a) What information does the above double graph depict?
(b) Name the fruits for which cost of 1 kg is greater in city I as compared to city II.
(c) What is the difference of rates for apples in both the cities?
(d) Find the ratio of the cost of mangoes per kg in city I to the cost of mangoes per kg in city II.
33.
We can draw exactly one triangle whose angles are 70°, 30° and 80°.
1.
\(\frac { 1 }{ 2 } \)
2.
We have, (-31) x (-100) = 31 x 100 =3100
3.
We have\(\frac{1}{5},\frac{3}{7},\frac{7}{10}\)

LCM of 5, 7 and 10 = 5\(\times\)7\(\times\)2 = 70
On converting given fractions into like fractions, we get
\(\frac { 1 }{ 5 } =\frac { 1\times 4 }{ 5\times 14 } =\frac { 14 }{ 70 } \)
\(\frac { 3 }{ 7 } =\frac { 3\times 10 }{ 7\times 10 } =\frac { 30 }{ 70 } \)
and \(\frac { 7 }{ 10 } =\frac { 7\times 7 }{ 10\times 7 } =\frac { 49 }{ 70 } \)
∵ 14 < 30 < 49 [numerators of fractions]
∴ \(\frac { 14 }{ 70 } <\frac { 30 }{ 70 } <\frac { 40 }{ 70 } \)
Thus,
Hence, descending order of given fractions is \(\frac { 7 }{ 10 } ,\frac { 3 }{ 7 } ,\frac { 1 }{ 5 } \)
4.
(-21) - (30) = (-21) + (-30) = -51 [\(\because\) (- )(-) = (+), higher integer sign is (-)]
5.
(-6) - (-16) = -6 + (16)= + 10 or 10 [\(\because\) (-)( -) = (+), difference = 10, higher integer sign is '+']
6.
14-(-20)=14+(20)=34 [\(\because\) (-)(-) = +]
7.
10 + (-4) = 10 - 4 = +6 or 6 [\(\because\) difference = 6, higher integer sign is' +']
8.
We have, -3 and 4
In this case, firstly we go to (-3) and then move (4) step to the right of (-3).
Thus, we reached to (1), i.e. (-3) + (4) = 1
9.
Given data are 1,4, 6, 5, 6, 2, 3, 4, 5, 3, 2, 4, 5,2 and 3.
On the basis of given data, we can arrange the data in tabular form:
| Data | Tally Marks | Frequency |
|---|---|---|
| 1 | I | 1 |
| 2 | III | 3 |
| 3 | III | 3 |
| 4 | III | 3 |
| 5 | III | 3 |
| 6 | II | 2 |
| Total | 15 | |
Since, mode is the observation having highest frequency.
Here, 2, 3, 4 and 5 have frequency as 3, so mode of the given data is 2, 3, 4 and 5, because all occur 3 times
10.
Given, a=18, b=15, c=13
Taking LHS,
a + (b + c) = 18 + (15 + 13) = 18 + 28 = 46
Now, taking RHS,
(a + b) + c = (18 + 15) + 13 = 33 + 13 = 46
Hence, a + (b + c) = (a + b) + C
11.
Given rational numbers are \(\frac { 1 }{ 3 } \) and \(\frac { 1 }{ 4 } \).
LCM of 3 and 4 is 12,
\(\frac { 1\times 4 }{ 3\times 4 } =\frac { 4 }{ 12 } \) and \(\frac { 1\times 3 }{ 4\times 3 } =\frac { 3 }{ 12 } \)
Now, \(\frac { 4\times 10 }{ 12\times 10 } =\frac { 40 }{ 120 }
\) and \(\frac { 3\times 10 }{ 12\times 10 } =\frac { 30 }{ 120 } \)
\(\frac { 30 }{ 120 } <\frac { 31 }{ 120 } <\frac { 32 }{ 120 } <\frac { 33 }{ 120 } <\frac { 34 }{ 120 } <\frac { 35 }{ 120 } <.......<\frac { 40 }{ 120 } \)
Hence, 5 rational numbers between \(\frac { 1 }{ 3 } \) and \(\frac { 1 }{ 4 } \) are
\(\frac { 31 }{ 120 } ,\frac { 32 }{ 120 } ,\frac { 33 }{ 120 } ,\frac { 34 }{ 120 } ,\frac { 35 }{ 120 } .\)
12.
If 40 is the pass mark, then students who getting less than 40 marks have failed. Hence, from the bargraph we can see students getting marks between 30-39 have failed i.e. 4 students have failed
13.
On arranging the data in ascending order, we get 12,12,12,13,13,13,13,14,14,14,14,14,15,15,15, 15,15,15,15,15,15,15,16,16,16,16,16,16,17,17, 18, 19
Now, we will arrange it in a table form
| Numbers | Occuring Time(Frequency) |
|---|---|
| 12 | Three times |
| 13 | Four Times |
| 14 | Five Times |
| 15 | Elevan times |
| 16 | Six times |
| 17 | Two Times |
| 18 | One times |
| 19 | One times |
It is clear from the table that, 15 occurs the maximum
number of times i.e 11.
Hence, mode of the data is 15.
14.
Here, the sea level is at 0 m and the plane is 5000m above the sea level.
\(\therefore\) Distance between plane and the sea level = 5000 m
Also, the submarine is floating 1200 m below the sea level.
\(\therefore\) Distance between the submarine and the sea level = 1200 m
Hence, the vertical distance between the plane and the submarine = Distance between the plane and the sea level + Distance between the sea level and submarine
= 5000 + 1200 = 6200 m
15.
(d)
60°
16.
(d)
2
17.
(c)
33
18.
(b)
27
19.
(c)
unlimited
20.
()
the hypotenuse
21.
The representation of data with bars of uniform width is called bar graph
22.
()
We have, (- 206) \(\div\) (- 206) = -206/-206 = 1 [ \(\because\) (-a) \(\div\) (-a) = 1 ]
23.
()
(- 3) x (- 9) = 27
24.
\(\frac { -2 }{ 9 } -\frac { 7 }{ 9 } =\frac { (-2+7) }{ 9 } =\frac { -9 }{ 9 } =-1\)
25.
()
26.
()
23
27.
()
60
28.
()
Highest observation - Lowest observation
29.
()
\(\left( \frac { bc }{ ad } \right) \)
30.
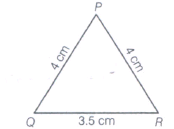
Given, three sides of \(\triangle PQR\) are PQ = 4 cm, QR = 35 cm and PR = 4cm.
To construct a triangle with given sides, we use the following steps:
Steps of construction
Step I Firstly, we draw a rough sketch with given measures marked on it.
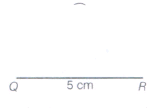
Step II Draw a line segment QR = 35 cm.

Step III With Q as centre and radius 4 cm, draw an arc.
Step IV Now, with R as centre and radius 4 cm, draw another arc intersecting the previous arc at P.
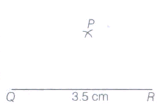
Step V Join PQ and PR.
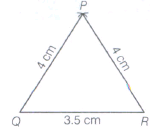
Thus, \(\triangle PQR\) is the required triangle.
Here, PQ = PR = 4 cm, i.e. two sides of \(\triangle PQR\) are equal.
Therefore, \(\triangle PQR\) is an isosceles triangle.
31.
The complete table is shown below
| Hudrends (100) | Tens (10) | Ones(1) | Tenths(\(\frac{1}{10}\)) | Hudrendths(\(\frac{1}{100}\)) | Thousandths(\(\frac{1}{1000}\)) | Number |
|---|---|---|---|---|---|---|
| 2 | 5 | 3 | 1 | 4 | 7 | 253.147 |
| 6 | 2 | 9 | 3 | 2 | 1 | 629.321 |
| 0 | 4 | 3 | 1 | 9 | 2 | 043.192 |
| 5 | 1 | 4 | 2 | 5 | 1 | 514.251 |
| 2 | 3 | 6 | 5 | 1 | 2 | 236.512 |
| 7 | 2 | 4 | 5 | 0 | 3 | 724.503 |
| 6 | 1 | 4 | 3 | 2 | 6 | 614.326 |
| 0 | 1 | 0 | 5 | 3 | 0 | 010.530 |
32.
After the study of double bar graph,
Cost of apple in city 1=82
Cost of apple in city II = 75
Cost of banana in city I = 45
Cost of banana in city II = 32
Cost of mango in city I = 75
Cost of mango in city II = 60
Cost of watermelon in city I = 20
Cost of watermelon in city II = 26
Cost of cherry in city I = 38
Cost of cherry in city II = 30
(a) Clearly, the double bar graph compares the cost of different fruits per kg in city I and II.
(b) Cost of apple in city I = 82, where in city II is = 75
Cost of Banana in city I = 45, where in city II = 32
Cost of Mango in city 1=75, where in city II = 60
Cost of Cherry in city I = 38, where in city II = 30
Hence, apple, banana, mango, and cherry
prices/costs in city I are greater than city II.
(c) Difference of rates for apples in cities I and II
= 82 -75 =7
(d) The ratio of the cost of mangoes per kg in city I to
the cost of mangoes per kg in city II
=75: 60 = 5: 4
33.
(b)

7th Standard CBSE Syllabus & Materials
7th Standard CBSE
CBSE 7th Social Science Theme B - New Beginnings : Cities and States - New Sample Question Papers Study Material - QB365 Set A
NEW7th Standard CBSE
CBSE 7th Social Science Theme A - Climates of India - New Sample Question Papers Study Material - QB365 Set A
NEW7th Standard CBSE
CBSE 7th Social Science Theme A - Geographical Diversity of India - New Sample Question Papers Study Material - QB365 Set A
NEW7th Standard CBSE
CBSE 7th Science Earth, Moon and the Sun - New Sample Question Papers Study Material - QB365 Set A



NCERT Books

Syllabus

Exam Pattern

Sample Question Papers

Previous year Question Papers

Important Notes

MCQ Practice test

NCERT Exemplers

Case study Questions

Image Based Questions

Passage based Questions

HOT Questions

Value Based Questions

Model Questions Papers
NCERT ( Book Back ) Questions

Assertion and Reason
Important Questions And Answers

CBSE 7th Standard CBSE Subjects
CBSE Standards


