
 100% FREE ACCESS
7th Standard CBSE Syllabus & Materials
7th Standard CBSE
CBSE 7th Social Science Theme E - Understanding Market - New Sample Question Papers Study Material - QB365 Set A
NEW7th Standard CBSE
CBSE 7th Social Science Theme E - From Barter to Money - New Sample Question Papers Study Material - QB365 Set A
NEW7th Standard CBSE
CBSE 7th Social Science Theme D - The Constitution of India- An Introduction - New Sample Question Papers Study Material - QB365 Set A
NEW7th Standard CBSE
CBSE 7th Social Science Theme D - From the Rulers to the Ruled : Types of Governments - New Sample Question Papers Study Material - QB365 Set A
NEW7th Standard CBSE
CBSE 7th Social Science Theme B - The Age of Reorganisation - New Sample Question Papers Study Material - QB365 Set A
NEW7th Standard CBSE
CBSE 7th Social Science Theme B - The Rise of Empires - New Sample Question Papers Study Material - QB365 Set A

Published on: 31/10/2025
Download CBSE Class 7th Standard CBSE Science question papers, sample papers, important questions, and previous year solved papers in PDF format. Get free study materials, NCERT solutions, and exam preparation resources for Class 7th Standard CBSE Science
Questions + Answers key
Take MCQ Science Test
1.
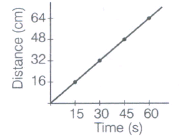
Plot a distance-time graph of the tip of the second hand of a clock by selecting 4 points on X-axis and Y-axis, respectively. The circumference of the circle traced by the second hand is 64 cm.
2.
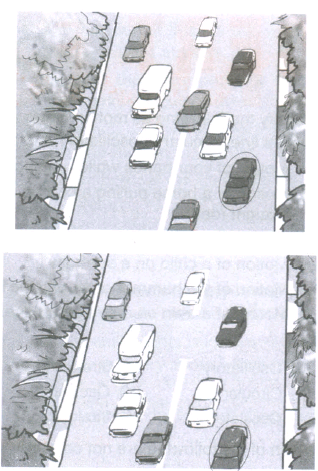
Suppose, the two photographs, shown in two figures had been taken at an interval of 10 s. If a distance of 100 m is shown by 1 cm in these photographs, then calculate the speed of the circled car.
3.
Salma takes 15 min from her house to reach her school on a bicycle. If the bicycle has a speed of 2 m/s, calculate the distance between her house and the school.
4.
Which of the following are not correct?
(a) The basic unit of time is second.
(b) Every object moves with a constant speed.
(c) Distances between two cities are measured in kilometres.
(d) The time period of a given pendulum is not constant.
(e) The speed of a train is expressed in m/h.
5.
Which one records the distance travelled by a vehicle?
Speedometer
Manometer
Motometer
Odometer
6.
If we denote speed by S, distance by D and time by T, the relationship between these quantities is
S =D \(\times\) T
\(T=\frac{S}{D}\)
\(S=\frac{1}{T}\times D\)
\(S=\frac{T}{D}\)
7.
How will you convert the speed given in km/h to m/s?
By multiplying with 5/16
By multiplying with 6/5
By multiplying with 18/5
By multiplying with 5/18
8.
What is the relation between distance and speed?
Distance = Speed \(\times\) Time
Distance = Speed/Time
Distance = Time/Speed
None of the above
9.
Which of the following relations is correct?
Speed = Distance \(\times\) Time
\(Speed=\frac{Distance}{Time}\)
\(Speed=\frac{Time}{Distance}\)
\(Speed=\frac{1}{Distance\times\ Time}\)
10.
A spaceship travels 36000 km in one hour. Express its speed in km/s.
11.
Briefly explain how will decide which object is moving fast and which one is moving slow.
12.
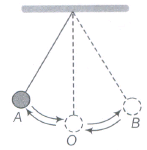
A simple pendulum is oscillating between two points A and B as shown in figure. Is the motion of the bob uniform or non-uniform?
13.
Give the basic unit of speed.
14.
Explain by giving example that how can we choose a suitable scale.
15.
Boojho goes to the football ground to play football. The distance-time graph of his journey from his home to the ground is given as figure.
(a) What does the graph between points B and C indicate about the motion of Boojho?
(b) Is the motion between 0 to 4 min uniform or non-uniform?
(c) What is his speed between 8 to 12 min of his journey.
16.
The distance-time graph for the motion of an object moving with a constant speed is a____________.
17.
Motion of objects can be represented in the pictorial form by their__________graph.
18.
A________________is one billionth of a second.
19.
The symbols of all units are written in_____________
20.
Time period of a pendulum depends on its_____________.
21.
Periodic events are used for the measurement of time.
22.
The distance-time graph of standing vehicle is a straight line parallel to x-axis.
23.
The symbols of all units are written in singular.
24.
The time period of simple pendulum is not constant.
25.
The distance-time graph of standing vehicle is a straight line parallel to x-axis.
26.
Month
27.
Second
28.
Days
29.
Minute
30.
Years
1.
| Time (s) | X | 15 | 30 | 45 | 60 |
| Distance (cm) | Y | 16 | 32 | 48 | 64 |
As, here equal distance is covered in equal intervals of time.
So, graph will be straight line
2.
Speed of the circled car is given by
\(=\frac{Distance\ covered}{Time\ taken}=\frac{100}{10\times 100}\)
\((1\ cm=\frac{1}{100}m)\)
\(=\frac{1}{10}m/s\)
3.
As, we know that
Distance covered by the body = Speed \(\times\) Time
speed = 2 m/s
Time =15 min =15 \(\times\) 60= 900s
So, distance = 900 \(\times\)2 = 1800 m = 1.8 km
4.
(b), (d) and (e) are not correct.
5.
(d)
Odometer
6.
(c)
\(S=\frac{1}{T}\times D\)
7.
(d)
By multiplying with 5/18
8.
(a)
Distance = Speed \(\times\) Time
9.
(b)
\(Speed=\frac{Distance}{Time}\)
10.
\(Speed=\frac{Distance}{Time}\)
\(=\frac{36000}{1\times3600}=\) [\(\therefore\) 1 h = 36000 s]
= 10 km/s
11.
If an object covers more distance in equal intervals of time with respect to other, then we can say that object is moving faster with respect to the other object.
12.
The motion of bob is non-uniform as it does not cover equal distance in equal intervals of time.
13.
Metre/second is the basic unit of speed.
14.
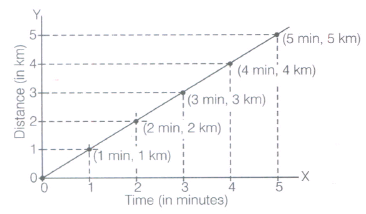
While choosing the most suitable scale for drawing a graph, we should keep the following points in mind
(i) The difference between the highest and lowest values of each quantity.
(ii) The intermediate values of each quantity so that with the scale chosen, it is easy to mark the values on the graph.
(iii) To utilise the maximum part of the paper on which the graph is to be drawn, assume that we have a graph paper of size 25 cm \(\times\) 25 cm and we have to accommodate following data:
| Tim (AM) | Odometer reading | Distance from the starting point |
| 8:00 AM | 36540 km | 0 km |
| 8:30 AM | 36560 km | 20 km |
| 9:00 AM | 36580 km | 40 km |
| 9:30 AM | 36600 km | 60 km |
| 10:00 AM | 36620 km | 80 km |
Since, one of the scales will be
Distance 5 km = 1 cm and Time 6 min = 1 cm
15.
(a) Since, the graph between B and C is parallel to time-axis, so it indicates that Boojho is at rest.
(b) Since, the graph is not straight line, so it is a non-uniform motion.
\(Speed=\frac{Distance}{Time}=\frac{225-150}{12-8}=\frac{75}{4}=18.75\ m/min\)
16.
()
straight line
17.
()
distance-time
18.
()
nanosecond
19.
()
singular
20.
()
length
21.
(a)
22.
(a)
23.
(a)
24.
(a)
25.
(a)
26.
()
gestation period in humans
27.
()
time to complete 100 m race
28.
()
rotation period of the earth on its axis
29.
()
time to reach your school
30.
()
age of a person

7th Standard CBSE Syllabus & Materials
7th Standard CBSE
CBSE 7th Social Science Theme B - New Beginnings : Cities and States - New Sample Question Papers Study Material - QB365 Set A
NEW7th Standard CBSE
CBSE 7th Social Science Theme A - Climates of India - New Sample Question Papers Study Material - QB365 Set A
NEW7th Standard CBSE
CBSE 7th Social Science Theme A - Geographical Diversity of India - New Sample Question Papers Study Material - QB365 Set A
NEW7th Standard CBSE
CBSE 7th Science Earth, Moon and the Sun - New Sample Question Papers Study Material - QB365 Set A



NCERT Books

Syllabus

Exam Pattern

Sample Question Papers

Previous year Question Papers

Important Notes

MCQ Practice test

NCERT Exemplers

Case study Questions

Image Based Questions

Passage based Questions

HOT Questions

Value Based Questions

Model Questions Papers
NCERT ( Book Back ) Questions

Assertion and Reason
Important Questions And Answers

CBSE 7th Standard CBSE Subjects
CBSE Standards


