
 100% FREE ACCESS
7th Standard CBSE Syllabus & Materials
7th Standard CBSE
CBSE 7th Social Science Theme E - Understanding Market - New Sample Question Papers Study Material - QB365 Set A
NEW7th Standard CBSE
CBSE 7th Social Science Theme E - From Barter to Money - New Sample Question Papers Study Material - QB365 Set A
NEW7th Standard CBSE
CBSE 7th Social Science Theme D - The Constitution of India- An Introduction - New Sample Question Papers Study Material - QB365 Set A
NEW7th Standard CBSE
CBSE 7th Social Science Theme D - From the Rulers to the Ruled : Types of Governments - New Sample Question Papers Study Material - QB365 Set A
NEW7th Standard CBSE
CBSE 7th Social Science Theme B - The Age of Reorganisation - New Sample Question Papers Study Material - QB365 Set A
NEW7th Standard CBSE
CBSE 7th Social Science Theme B - The Rise of Empires - New Sample Question Papers Study Material - QB365 Set A

Published on: 30/07/2018
Based on the chapter Data Handling, some of the important questions are prepared in this question paper.
For parents, Please subscribe and get the plenty of question with answer for your children practice. For Subscription please Click here.
Download CBSE Class 7th Standard CBSE Mathematics question papers, sample papers, important questions, and previous year solved papers in PDF format. Get free study materials, NCERT solutions, and exam preparation resources for Class 7th Standard CBSE Mathematics
Questions + Answers key
Take MCQ Mathematics Test
1.
If the arithmetic mean of 6, 8, 5, 7, P and 4 is 7, then find the value of p.
2.
The heights of 10 girls were measured (in cm) and the results are as follows: 135, 150,139, 128, 151, 132, 146, 149, 143, 141 - How many girls have heights more than the mean height?
3.
A cricketer scores the following runs in eight innings: 58, 76, 40, 35, 46, 45, 0, 100 Find the mean score
4.
Weight (in kg) atleast 20 children (girls and boys) of your class. Organise the data and answer the following questions using this data. What is the most common weight?
5.
Find the median of the following data:35, 32, 35, 42, 38, 32, 34
6.
Read the bar graph (in the given figure), which shows the number of books sold by a bookstore during five consecutive years and answer the following questions.
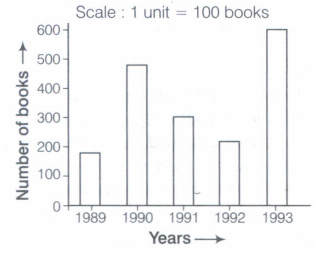
In which year were about 475 books sold? About 225 books sold?
7.
Use the bar graph (in the given figure) to answer the following questions.
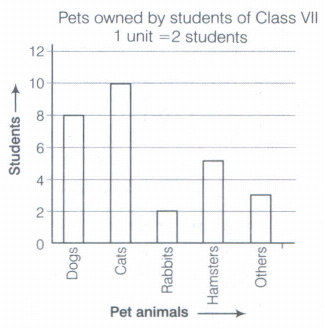
Which is the most popular pet?
8.
The bar graph given below shows the marks of students of a class in a particular subject
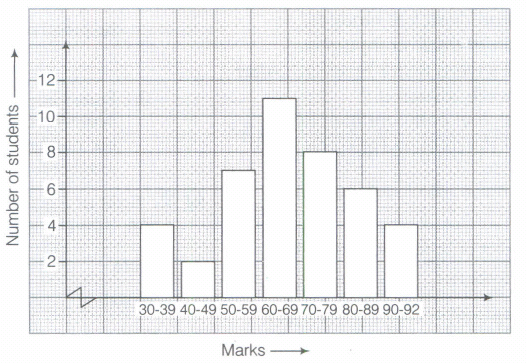
How many students got marks from 50 to 69?
9.
The rainfall (in mm) in a city on 7 days of a certain week was recorded as follows:
| Day | Mon | Tue | Wed | thurs | Fri | Sat | Sun |
|---|---|---|---|---|---|---|---|
| Rainfall(in mm) | 0.0 | 12.2 | 2.1 | 0.0 | 20.5 | 5.5 | 1.0 |
Find the mean rainfall for the week
10.
Following table shows the points of each player scored in four games
| Players | Game | Game | Game | Game |
|---|---|---|---|---|
| 1 | 2 | 3 | 4 | |
| A | 14 | 16 | 10 | 10 |
| B | 0 | 8 | 6 | 4 |
| C | 8 | 11 | Did not play | 13 |
Who is the best performer?
11.
The mean of 2, 18, 46 is 22 is equal to mean of 10,12,26.
12.
The mean of the data 20, 40, 60, 80, 70 is 55.
13.
The range of the data 2, - 5, 4, 3, 7 and 6 would change, if 2 is subtracted from each value in the data.
14.
The data 6, 4, 3, 8, 9, 12, 13, 9 has mean 9
15.
The mean is one of the numbers in a data
16.
The mean of three numbers is 20 and the mean of other four numbers is 26. Find the mean of all the numbers.
17.
Study the double bar graph given below and answer the questions that follow:
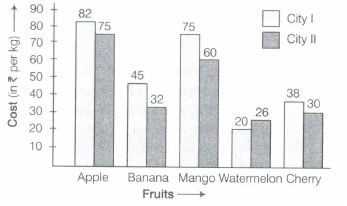
(a) What information does the above double graph depict?
(b) Name the fruits for which cost of 1 kg is greater in city I as compared to city II.
(c) What is the difference of rates for apples in both the cities?
(d) Find the ratio of the cost of mangoes per kg in city I to the cost of mangoes per kg in city II.
18.
If 12 observation's mean is 6. Then, the sum of 12 observations is....................
19.
When a die is thrown the probability of getting a number less than 3 is......................
20.
The range of data 17, 26, 33, 37, 61, 69, 91,97 is ______
21.
If the arithmetic mean of 8, 4, x, 6, 2, 7 is 5, then the value of x is
22.
The median of any data lies between the ... and ... observations.
23.
A bag is having 4 red balls and 6 yellow balls. If a ball is pulled out without seeing them, then find the probability of getting a red ball.
\(\frac { 2 }{ 5 } \)
\(\frac { 3 }{ 5 } \)
\(\frac { 9 }{ 12 } \)
\(\frac { 2 }{ 3 } \)
24.
The money saved by a student during first six days of a week are Rs. 46, Rs. 24, Rs 29, Rs 27, Rs. 4 and Rs 42. Find the average saving per day.
42
39
35
36
25.
Which measures of central tendency get affected, if the extreme observations on both the ends of a data a arranged in descending order are removed?
Mean and mode
Mean and median
Mode and median
Mean, median and mode
26.
The number of trees in different parks of a city are 33, 38, 48, 33, 34, 34, 33 and 24. The mode of this data is
24
34
33
48
27.
The median of the data 2, 16, 29, 88, 49, 99,16,4,37 is
16
29
99
88
1.
p = 12
2.
On arranging the data in ascending order, we get 128,132,135,139,141,143,146,149,150,151
It is clear that, we have mean height = 141.4 cm Hence, 5 girls have more height than the mean height i.e. 143cm, 146cm, 149cm, 150cm and 151 cm
3.
Here, sum of rotal runs
= 58 + 76 + 40 + 35 + 46 + 45 + 0 + 100 = 400
Number of innings = 8
\(\therefore\) mean score = \(\frac { total\ runs }{ number\ of\ innings } =\frac { 400 }{ 8 } =50\)
Hence, the mean score is 50 runs
4.
Let the weight (in kg) of 20 children of your classare as follows:
35, 35, 40, 33, 36, 40, 50, 38, 45, 34,
40, 40, 37, 34, 32, 48, 42, 35, 36, 40
Now, arranging the weight of 20 children of your class in descending order, we have
50, 48, 45, 42, 40, 40, 40, 40, 40, 38
37, 36, 36, 35, 35, 35, 34, 34, 33, 32
The most common weight is 40 kg, because five children have 40 kg weight.
5.
Given data are 35,32, 35, 42, 38, 32 and 34.
For median of the given data, we first arrange the given data in ascending order, we get
Here, n = 7, which is odd
\(\left( \frac { n+1 }{ 2 } \right) ^{ th }\) data will be the median i.e. \(\frac { 7+1 }{ 2 } =\frac { 8 }{ 2 } \)=4th observation
Hence, 4th observation, i.e. 35 is the median of the given data
6.
About 475 books were sold in the year 1990 and about 225 books were sold in the year 1992.
7.
From the given graph, it is clear that the bar representing cat is the highest i.e. 10.
Therefore, cat is the most popular pet.
8.
Number of students getting marks from 50-69
= Number of students getting marks from 50-59 + Number of students getting marks from 60-69
= 7+11=18
9.
On arranging the adjacent data in descending order, we get
| Day | Fri | tue | Sat | Wed | sun | mon | Thurs |
|---|---|---|---|---|---|---|---|
| Rainfall(in mm) | 20.5 | 12.2 | 5.5 | 2.1 | 1.0 | 0.0 | 0.0 |
Here, total rainfall
= 0.0+ 12.2+ 2.1 + 0.0+ 20.5+ 5.5+ 1.0= 41.3 mm
Number of days = 7
\(\therefore\) Mean rainfall = \(\frac { total\quad rain\quad fall }{ number\quad of\quad days } =\frac { 41.3 }{ 7 } =5.9mm\)
Hence, mean rainfall for the week is 5.9 mm
10.
Average number of points scared by A = 12.5 [as calculated in part (i)]
Average number of points scared by B = 4.5 [as calculated in part (iii)]
\(=\frac { sum\ of\ points\ in\ games }{ number\ of\ games } \)
= \(\frac { 8+11+13 }{ 3 } =\frac { 32 }{ 3 } \) =10.67
\(\because\) 12.5 > 10.67 > 4.5
Hence, A is the best performer.
11.
(b)
12.
(b)
13.
(b)
14.
(b)
15.
(b)
16.
23.42
17.
After the study of double bar graph,
Cost of apple in city 1=82
Cost of apple in city II = 75
Cost of banana in city I = 45
Cost of banana in city II = 32
Cost of mango in city I = 75
Cost of mango in city II = 60
Cost of watermelon in city I = 20
Cost of watermelon in city II = 26
Cost of cherry in city I = 38
Cost of cherry in city II = 30
(a) Clearly, the double bar graph compares the cost of different fruits per kg in city I and II.
(b) Cost of apple in city I = 82, where in city II is = 75
Cost of Banana in city I = 45, where in city II = 32
Cost of Mango in city 1=75, where in city II = 60
Cost of Cherry in city I = 38, where in city II = 30
Hence, apple, banana, mango, and cherry
prices/costs in city I are greater than city II.
(c) Difference of rates for apples in cities I and II
= 82 -75 =7
(d) The ratio of the cost of mangoes per kg in city I to
the cost of mangoes per kg in city II
=75: 60 = 5: 4
18.
\(Mean= \frac { sum\ of\ observations }{ number\ of\ observatins } \)
\(6=\frac { sum\ of\ observations }{ 12 } \)
Sum of observations = 12 x 6 = 72
19.
number less than 3 are 1 and 2
p (getting a number less thn 3) = \(\frac { 2 }{ 6 } =\frac { 1 }{ 3 } \)
20.
Range = maximum vale - minimum value
= 97 - 17 = 80
21.
Arithmetic mean 8, 4 ,x,6,2,7 is 5
Arithmetic mean = \(\frac { sum\ of\ observations }{ number\ of\ observations } \)
Sum of observations = 8 + 4 + x + 6 2 + 7 = 27 +x
5 =\(\frac { 27+x }{ 6 } \Rightarrow 5\times 6=27+x\)
30 = 27 +x \(\Rightarrow\) x = 30 -27 = 3
22.
\(\underset { \overset { \downarrow }{ minimum\quad value } }{ 1 } ,2,4,\underset { \overset { \downarrow }{ median } }{ 6 } ,8,9,\underset { \overset { \downarrow }{ maximum\quad value } }{ 11 } \)
23.
(a)
\(\frac { 2 }{ 5 } \)
24.
25.
(a)
Mean and mode
26.
(c)
33
27.
(b)
29

7th Standard CBSE Syllabus & Materials
7th Standard CBSE
CBSE 7th Social Science Theme B - New Beginnings : Cities and States - New Sample Question Papers Study Material - QB365 Set A
NEW7th Standard CBSE
CBSE 7th Social Science Theme A - Climates of India - New Sample Question Papers Study Material - QB365 Set A
NEW7th Standard CBSE
CBSE 7th Social Science Theme A - Geographical Diversity of India - New Sample Question Papers Study Material - QB365 Set A
NEW7th Standard CBSE
CBSE 7th Science Earth, Moon and the Sun - New Sample Question Papers Study Material - QB365 Set A



CBSE 7th Standard CBSE Subjects
CBSE Standards




