
 100% FREE ACCESS
10th Standard CBSE Syllabus & Materials
10th Standard CBSE
CBSE 10th Social Science ECO - Globalisation and the Indian Economy - New Model Questions Papers Study Material - QB365 Set A
NEW10th Standard CBSE
CBSE 10th Social Science ECO - Money and Credit - New Model Questions Papers Study Material - QB365 Set A
NEW10th Standard CBSE
CBSE 10th Social Science ECO - Sectors of the Indian Economy - New Model Questions Papers Study Material - QB365 Set A
NEW10th Standard CBSE
CBSE 10th Social Science ECO - Development - New Model Questions Papers Study Material - QB365 Set A
NEW10th Standard CBSE
CBSE 10th Social Science PS - Outcomes of Democracy - New Model Questions Papers Study Material - QB365 Set A
NEW10th Standard CBSE
CBSE 10th Social Science PS - Gender, Religion and Caste - New Model Questions Papers Study Material - QB365 Set A

Published on: 25/07/2018
Statistics - Model Question Paper
Download CBSE Class 10th Standard CBSE Maths question papers, sample papers, important questions, and previous year solved papers in PDF format. Get free study materials, NCERT solutions, and exam preparation resources for Class 10th Standard CBSE Maths
Questions + Answers key
Take MCQ Maths Test
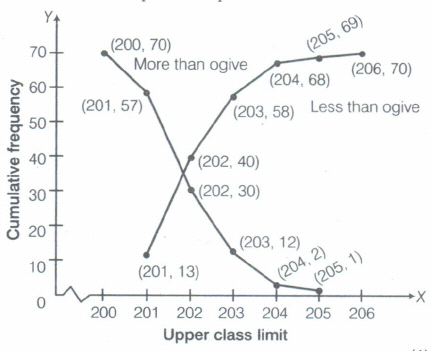
1.
The weights of tea in 70 packets are shown in the following table:
| Weight (in grams) | 200-201 | 201-202 | 202-203 | 203-204 | 204-205 | 205-206 |
|---|---|---|---|---|---|---|
| Number of packets | 13 | 27 | 18 | 10 | 1 | 1 |
Draw the 'less than type' and 'more than type' ogives for the data.
2.
In a class test, marks obtained by 120 students are given in the following frequency distribution. If it is given that mean is 59, then find the missing frequencies x and y.
| Marks | Number of students |
|---|---|
| 0-10 | 1 |
| 10-20 | 3 |
| 20-30 | 7 |
| 30-40 | 10 |
| 40-50 | 15 |
| 50-60 | x |
| 60-70 | 9 |
| 70-80 | 27 |
| 80-90 | 18 |
| 90-100 | y |
3.
Find the mode of the following frequency distribution:
| Class Interval | f |
| 25-35 | 7 |
| 35-45 | 31 |
| 45-55 | 33 |
| 55-65 | 17 |
| 65-75 | 11 |
| 75-85 | 1 |
4.
On annual day of a school, 400 students participated in the function. Frequency distribution showing their ages is as shown in the following table:
| Ages (in years) | 05-07 | 07-09 | 09-11 | 11-13 | 13-15 | 15-17 | 17-19 |
| Number of students | 70 | 120 | 32 | 100 | 45 | 28 | 5 |
Find mean and median of the above data
5.
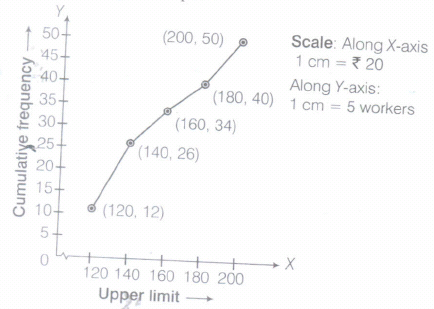
The following distribution gives the daily income of 50 workers of a factory:
| Daily income (in RS) | 100-120 | 120-140 | 140-160 | 160-180 | 180-200 |
|---|---|---|---|---|---|
| Number of workers | 12 | 14 | 8 | 6 | 10 |
Convert the distribution above to a 'less than type' cumulative frequency distribution and draw its ogive.
6.
If the median of the following frequency distribution is 46, then find the missing frequencies.
| Class interval | 10-20 | 20-30 | 30-40 | 40-50 | 50-60 | 60-70 | 70-80 | Total |
|---|---|---|---|---|---|---|---|---|
| Frequency | 12 | 30 | ? | 65 | ? | 25 | 18 | 230 |
7.
Following is the cumulative frequency distribution (of less than type) of 1000 persons each of age 20 yr and above. Determine the mean age.
| Age (in years) | Below 30 | Below 40 | Below 50 | Below 60 | Below 70 | Below 80 |
|---|---|---|---|---|---|---|
| Number of persons | 100 | 220 | 350 | 750 | 950 | 1000 |
8.
The following table gives the distribution of the life time of 400 neon lamps :
| Lifetime (in hours) | Number of lamps |
|---|---|
| 1500-2000 | 14 |
| 2000-2500 | 56 |
| 2500-3000 | 60 |
| 3000-3500 | 86 |
| 3500-4000 | 74 |
| 4000-4500 | 62 |
| 4500-5000 | 48 |
Find the median lifetime of a lamp.
9.
A student noted the number of cars passing through a spot on a road for 100 periods each of 3 min and summarised it in the table given below:
| Number of cars | 0-10 | 10-20 | 20-30 | 30-40 | 40-50 | 50-60 | 60-70 | 70-80 |
|---|---|---|---|---|---|---|---|---|
| Frequency | 7 | 14 | 13 | 12 | 20 | 11 | 15 | 8 |
Find the mode of the data.
10.
The following distribution shows the daily pocket allowance of children of a locality. The mean pocket allowance is RS.18. Find the missing frequency f.
| Daily pocket allowance (in RS) | Number of children |
|---|---|
| 11-13 | 7 |
| 13-15 | 6 |
| 15-17 | 9 |
| 17-19 | 13 |
| 19-21 | f |
| 21-23 | 5 |
| 23-25 | 4 |
11.
Write frequency distribution table for the following data:
| Marks | Below 10 | Below 20 | Below 30 | Below 40 | Below 50 | Below 60 |
|---|---|---|---|---|---|---|
| Number of students | 0 | 15 | 20 | 30 | 35 | 40 |
12.
Given below is a cumulative frequency distribution showing the marks secured by 50 students of a class
| Marks | Number of students |
|---|---|
| Below 20 | 17 |
| Below 40 | 22 |
| Below 60 | 29 |
| Below 80 | 37 |
| Below 100 | 50 |
Form the frequency distribution table for the above data.
13.
Find the unknown entries a, b, c, d in the following distribution of heights of students in a class
| Height (in cm) | Frequiency | Cumulative Frquency |
|---|---|---|
| 150-155 | 12 | 12 |
| 155-160 | a | 25 |
| 160-165 | 10 | b |
| 165-170 | c | 43 |
| 170-175 | 5 | 48 |
| 175-180 | 2 | d |
14.
Given below is the distribution of weekly pocket money received by students of a class. Calculate the pocket money that is received by most of the students.
| Pocket Money (in Rs) | 0-20 | 20-40 | 40-60 | 60-80 | 80-100 | 100-120 | 120-140 |
|---|---|---|---|---|---|---|---|
| Number of students | 2 | 2 | 3 | 12 | 18 | 5 | 2 |
15.
Construct the frequency distribution table for the given data.
| Marks | Number of students |
|---|---|
| Less than 10 | 14 |
| Less than 20 | 22 |
| Less than 30 | 37 |
| Less than 40 | 58 |
| Less than 50 | 67 |
| Less than 60 | 75 |
1.
2.
Let the assumed mean, a=55 and width of class interval, h=10.Table for given data is
| Marks | Class marks (xi) | Number of students (fi) | \(u_{ i }=\frac { x_{ i }-a }{ h } \) | fiui |
|---|---|---|---|---|
| 0-10 | 5 | 1 | -5 | -5 |
| 10-20 | 15 | 3 | -4 | -12 |
| 20-30 | 25 | 7 | -3 | -21 |
| 30-40 | 35 | 10 | -2 | -20 |
| 40-50 | 45 | 15 | -1 | -15 |
| 50-60 | 55=a | x | 0 | 0 |
| 60-70 | 65 | 9 | 1 | 9 |
| 70-80 | 75 | 27 | 2 | 54 |
| 80-90 | 85 | 18 | 3 | 54 |
| 90-100 | 95 | y | 4 | 4y |
| Total | \(N=\sum { f_{ i } } =90+x+y\) | \(\sum { f_{ i }u_{ i } } =44+4y\) |
Now, we have, N=90+x+y
\(\Rightarrow \quad 120=90+x+y\)
\(\Rightarrow \quad x+y=30\)
\(\because \quad Mean=59\)
\(\Rightarrow \quad a+\left( \frac { \sum { f_{ i }u_{ i } } }{ N } \right) \times h=59\)
\(\Rightarrow \quad 55+\left( \frac { 44+4y }{ 120 } \right) \times 10=59\)
\(\Rightarrow \quad \frac { 11+y }{ 3 } =4\)
\(\Rightarrow \quad 11+y=12\)
\(\Rightarrow \quad y=1\)
On putting the value of y in Eq.(i), we get
x + 1 = 30⇒ x = 29
Hence, x = 29 and y = 1.
3.
Mode = \(l+\frac { f_{ 1 }-f_{ 0 } }{ 2f_{ 1 }-f_{ 0 }-f_{ 2 } } \times h\)
\(l+\frac { f_{ 1 }-f_{ 0 } }{ 2f_{ 1 }-f_{ 0 }-f_{ 2 } } \times h\)
\(=45+\frac { 2 }{ 18 } x10\)
=46.1
4.
| C.I | fi | c.f | xi | \(u_{ i }=\frac { x_{ i }-a }{ n } \) | \(f_{ i }u_{ i }\) |
| 05-07 | 70 | 70 | 6 | -3 | -210 |
| 07-09 | 120 | 190 | 8 | -2 | -240 |
| 09-11 | 32 | 222 | 10 | -1 | -32 |
| 11-13 | 100 | 322 | 12 | 0 | 0 |
| 13-15 | 45 | 367 | 14 | 1 | 45 |
| 15-17 | 28 | 395 | 16 | 2 | 56 |
| 17-19 | 5 | 400 | 18 | 3 | 15 |
| \(\Sigma f=400\) | \(\Sigma f_{ i }u_{ i }=-366\) |
a = Assumed mean = 12
Mean \(\overset { - }{ =a+x } \frac { \Sigma f_{ i }u_{ i } }{ \Sigma f_{ i } } \times h\)
Mean =12+\(\frac { -366 }{ 400 } \times 2=10.17\)
\(\frac { \Sigma f }{ 2 } =200\Rightarrow \) Median class=09-11
5.
6.
34, 46
7.
Firstly, we make the frequency distribution of the given data and then proceed to calculate mean by computing class marks (xi), u's and fiui 's as follows
| Age (in years) | Number of persons (fi) | Class marks (xi) | \(u_{ i }=\frac { x_{ i }-45 }{ 10 } \) | fiui |
|---|---|---|---|---|
| 20-30 | 100 | 25 | -2 | -200 |
| 30-40 | 120 | 35 | -1 | -120 |
| 40-50 | 130 | 45 | 0 | 0 |
| 50-60 | 400 | 55 | 1 | 400 |
| 60-70 | 200 | 65 | 2 | 400 |
| 70-80 | 50 | 75 | 3 | 150 |
| Total | \(\sum { f_{ i } } =1000\) | \(\sum { f_{ i }u_{ i } } =630\) |
Here, assumed mean, a = 45 (2) and class width, h = 10..By step deviation method,
Mean \(\left( \overline { x } \right) =a+\left\{ \frac { \sum { f_{ i }u_{ i } } }{ \sum { f_{ i } } } \right\} \times h=45+\left\{ \frac { 630 }{ 1000 } \right\} \times 10\)
=45+63=51.3
Hence, the required mean age is 51.3 yr.
8.
The cumulative frequencies with their respective class intervals are as follows.
| Life time | Number of lamps (fi) | Cumulative frequency |
| 1500 − 2000 | 14 | 14 |
| 2000 − 2500 | 56 | 14 + 56 = 70 |
| 2500 − 3000 | 60 | 70 + 60 = 130 |
| 3000 − 3500 | 86 | 130 + 86 = 216 |
| 3500 − 4000 | 74 | 216 + 74 = 290 |
| 4000 − 4500 | 62 | 290 + 62 = 352 |
| 4500 − 5000 | 48 | 352 + 48 = 400 |
| Total (n) | 400 |
It can be observed that the cumulative frequency just greater than n/2 (i.e 400/2 = 200) is 216
belonging to class interval 3000 − 3500.
Median class = 3000 − 3500
Lower limit (l) of median class = 3000
Frequency (f) of median class = 86
Cumulative frequency (cf) of class preceding median class = 130
Class size (h) = 500
\(\text { Median }=l+\left(\frac{\frac{n}{2}-c f}{f}\right) \times h \)
\(=3000+\left(\frac{200-130}{86}\right) \times 500 \)
\(=3000+\frac{70 \times 500}{86}\)
= 3406.976
Therefore, median life time of lamps is 3406.98 hours.
9.
From the given data, it can be observed that the maximum class frequency is 20, belonging to 40 − 50 class intervals.
Therefore, modal class = 40 − 50
Lower limit (l) of modal class = 40
Frequency (f1) of modal class = 20
Frequency (f0) of class preceding modal class = 12
Frequency (f2) of class succeeding modal class = 11
Class size = 10
\(\text { Mode }=l+\left(\frac{f_{1}-f_{0}}{2 f_{1}-f_{0}-f_{2}}\right) \times h \)
\(=40+\left[\frac{20-12}{2(20)-12-11}\right] \times 10\)
= 40+((80)/(40-23))
= 40 + 4.7
= 44.7
Therefore, mode of this data is 44.7 cars.
10.
Table for the given data is
| Daily pocket allowance (in Rs) | Number of children (fi) | Class marks (xi) | di=xi=-18 | fidi |
|---|---|---|---|---|
| 11-13 | 7 | 12 | -6 | -42 |
| 13-15 | 6 | 14 | -4 | -24 |
| 15-17 | 9 | 16 | -2 | -18 |
| 17-19 | 13 | 18=a | 0 | 0 |
| 19-21 | f | 20 | 2 | 2 f |
| 21-23 | 5 | 22 | 4 | 20 |
| 23-25 | 4 | 24 | 6 | 24 |
| Total | N=44+f | \(\sum { f_{ i }d_{ i } } =2f-40\) |
Here, a = 18, N = 44 + f and \(\sum\)fidi = 2f - 40
\(\begin{aligned} \therefore \quad \operatorname{Mean}(\bar{x}) & =a+\frac{1}{N} \times \Sigma f_i d_i \\ \end{aligned}\)
\(\begin{aligned} =18+\frac{1}{(44+f)} \times(2 f-40) \end{aligned}\) ...(i)
But mean = 18 [given] ...(ii)
On equating Eqs. (i) and (ii), we get
\(\begin{array}{rlrl} 18 & =18+\frac{1}{(44+f)} \times(2 f-40) \\ \end{array}\)
\(\begin{array}{rlrl} & \Rightarrow & 0 & =\frac{2 f-40}{44+f} \end{array}\)
\(\begin{array}{rlrl} \Rightarrow & 2 f-40 =0 \Rightarrow 2 f=40 \\ \end{array}\)
\(\begin{array}{rlrl} \therefore f =\frac{40}{2}=20 \end{array}\)
Hence, the missing frequency is 20.
11.
| Marks | Number of students |
|---|---|
| 10-20 | 15 |
| 20-30 | 20-15=5 |
| 30-40 | 30-20=10 |
| 40-50 | 35-30=5 |
| 50-60 | 40-35=5 |
12.
| Classes | Frequency |
|---|---|
| 0-20 | 17 |
| 20-40 | 5 |
| 40-60 | 7 |
| 60-80 | 8 |
| 80-100 | 13 |
| Total | 50 |
13.
From the table
12+a=25 \(\Rightarrow \) a=25-12=13
25+10=b \(\Rightarrow \) b=35
b+c=43 \(\Rightarrow \) c=43-b=43-35 =8
48+2=d \(\Rightarrow \) d=50
14.
| Class Interval | Frequency |
|---|---|
| 0-20 | 2 |
| 20-40 | 2 |
| 40-60 | 3 |
| 60-80 | 12 |
| 80-100 | 18 |
| 100-120 | 5 |
| 120-140 | 2 |
| Total | 44 |
Modal Class = 80- 100
i=80 , f1=18 , f2=5,f0=12,h=20
Model = i + \(\left( \frac { f_{ i }-f_{ 0 } }{ 2f_{ i }-f_{ 0 }-f_{ 2 } } \right) \times 20\)
\(=80+\left( \frac { 18-12 }{ 36-12-5 } \right) \times 20\)
\(=80+\frac { 6 }{ 19 } \times 20\)
=80+6.31
=86.31
15.
Here, we have the cumulative frequency distribution of less than type. We observe that the number of students getting marks less than 10 is 14 and 22 students have marks less than 20.
Therefore, number of students getting marks between 10 and 20 is 22-14=8. Similarly, the number of students getting marks between 20 and 30 is 37-22=15 and so on.
Thus, we have the following frequency distribution table
| Marks | Number of students |
|---|---|
| 0-10 | 14 |
| 10-20 | 22-14=8 |
| 20-30 | 37-22=15 |
| 30-40 | 58-37=21 |
| 40-50 | 67-58=9 |
| 50-60 | 75-67=8 |

10th Standard CBSE Syllabus & Materials
10th Standard CBSE
CBSE 10th Social Science PS - Federalism - New Model Questions Papers Study Material - QB365 Set A
NEW10th Standard CBSE
CBSE 10th Social Science PS - Power Sharing - New Model Questions Papers Study Material - QB365 Set A
NEW10th Standard CBSE
CBSE 10th Social Science GEO - Manufacturing Industries - New Model Questions Papers Study Material - QB365 Set A
NEW10th Standard CBSE
CBSE 10th Social Science GEO - Minerals and Energy Resources - New Model Questions Papers Study Material - QB365 Set A



CBSE 10th Standard CBSE Subjects
CBSE Standards





