
 100% FREE ACCESS
12th Standard CBSE Syllabus & Materials
12th Standard CBSE
CBSE 12th Economics Government Budget and the Economy Previous year Question Papers Study Material - QB365 Set A
NEW12th Standard CBSE
CBSE 12th Computer Science Interface Python with MySQL - New Previous year Question Papers Study Material - QB365 Set A
NEW12th Standard CBSE
CBSE 12th Computer Science Database Concept - New Previous year Question Papers Study Material - QB365 Set A
NEW12th Standard CBSE
CBSE 12th Computer Science Data Communication - New Previous year Question Papers Study Material - QB365 Set A
NEW12th Standard CBSE
CBSE 12th Computer Science Data Structures - New Previous year Question Papers Study Material - QB365 Set A
NEW12th Standard CBSE
CBSE 12th Computer Science Functions - New Previous year Question Papers Study Material - QB365 Set A

Published on: 24/09/2019
The Theory of the Firm Under Perfect Competition
Download CBSE Class 12th Standard CBSE undefined question papers, sample papers, important questions, and previous year solved papers in PDF format. Get free study materials, NCERT solutions, and exam preparation resources for Class 12th Standard CBSE undefined
Questions + Answers key
Take MCQ Biology Test
1.
Explain the effect of rise in input prices on the supply of a good.
2.
Given below is a cost and revenue schedule of a producer. At what level of output is the producer in equilibrium? Give reason for your answer.
| Output (units) | Price (Rs.) | Total cost (Rs.) |
| 1 | 10 | 13 |
| 2 | 10 | 22 |
| 3 | 10 | 30 |
| 4 | 10 | 38 |
| 5 | 10 | 47 |
| 6 | 10 | 57 |
| 7 | 10 | 71 |
3.
Explain the determinants of the market supply of a commodity.
4.
Will a profit-maximizing firm in a competitive market produce a positive level of output in the short-run if the market price is less than the minimum of AVC? Give an explanation.
5.
What are the characteristics of a perfectly competitive market?
6.
If a farmer grows rice and wheat, how will an increase in the price of wheat affect the supply curve of rice?
7.
How can the effective tax policies of the government help in controlling the supply of a harmful product like liquor?
8.
Explain the effect of rise in input prices on the supply of good.
9.
State three causes of increase in supply.
10.
Give three reasons for a rightward shift of supply curve of a commodity.
11.
How does technological progress affect the supply curve of a firm?
12.
What is the relation between market price and average revenue of a price-taking firm?
13.
What is the 'price line'?
14.
What does the price elasticity of supply mean? How do we measure it?
15.
What is the supply curve of a firm in the short-run?
1.
A change in the input prices affects a firm's supply curve. If the price of an input, say,the wage rate of labour increases, the cost of production will also increase. The consequent increase in the firm's Average Cost at any level of output is usually accompanied by an increase in the firm's Marginal Cost at any level of output. That is,there is a leftward (or upward) shift of the MC curve. This means that the firm's supply curve shifts to the left. At any given market price, the firm now supplies fewer units of output. In other words, an increase (decrease) in input prices is expected to shift the supply curve of a firm to the left (right).
2.
Producer's equilibrium is determined in the table below:
| Output (units) | Price (Rs.) | Total Revenue (Rs.) | Total Cost (Rs.) |
Profit/Loss TR-TC |
|---|---|---|---|---|
| 1 | 10 | 10 | 13 | -3 |
| 2 | 10 | 20 | 22 | -2 |
| 3 | 10 | 30 | 30 | 0 |
| 4 | 10 | 40 | 38 | 2 |
| 5 | 10 | 50 | 47 | 3 |
| 6 | 10 | 60 | 57 | 3 |
| 7 | 10 | 70 | 71 | -1 |
Thus profit maximizing output is 5th and 6th units because at this level the difference of TR and TC is maximum, that is Rs.3.
3.
Market supply curve is derived by the horizontal summation of individual supply curves. The determinants of the market supply of a commodity are as follows:
(i) Number of Firms: An increase (a decrease) in the number of firms shifts the market supply curve to the right (left).
(ii) Technological Changes: Technological progress shifts the market supply curve to the right. Similarly, technological degradation shifts the market supply curve to the left.
(iii) Input Price Changes: An increase (a decrease) in an input price shifts the supply curve to the left (right).
(iv) Change in the Excise Tax Rate: An increase (a decrease) in the excise tax shifts the market supply curve to the left (right).
(v) Change in the Price of Related Products: An increase (a decrease) in the price of a substitute good in production shifts the supply curve of a good to the left (right) .
4.
No, a profit maximising firm in competitive market will not produce a positive level of output in the short-run Y if the market price is less than the minimum of Average Variable Variable Cost
(P < min AVC).
In the diagram, a profit maximising firm produces zero output inthe short-run when the market price (P) is less than the minimum of its average variable cost (AVC).if the firm is producing an output level of \(\\ Oq_{ 1 }\) This firms Total Variable Cost exceeds its revenue by an amount equal to the area of rectangle PEBA. This means that \(\\ Oq_{ 1 }\)cannot be a profit maximising output level. An output level where price is less than the minimum of Average Variable Cost is the shut-down point for the firm. A firm should 'not operate at this level.
5.
Following are the characteristics of a perfectly competitive market
(i) Very Large Number of Buyers and Sellers: There is such a large number of buyers and sellers that none them is in a position to influence the price in the market. The price of a good is determined by the whole industry, that is, by the combined actions of all the sellers and buyers. The firms are, therefore, called price-takers under perfect competition.
(ii) Homogeneous Goods: The goods sold in the market are homogeneous or identical in every aspect like quality, size, design, colour, etc. The goods are perfect substitutes of one another. As a result, no buyer has reasons to be attached to a particular firm. No seller can charge a higher price otherwise he will lose his customers.
(iii) Free Entry and Exit: Buyers and sellers (firms) are free to enter or leave the market at any time they like. Large profits will induce the new firms to enter the industry; whereas losses will compel ~ inefficient firms to leave the industry.
(iv) Perfect Knowledge: Buyers and sellers have perfect knowledge about the prices and costs of the goods in different parts of the market. Evidently,this leads to ~mergence of uniform price of the product since no seller can afford to charge a price higher than. the prevailing one otherwise he . will lose all his customers to his competitors.
(v) Absence of Transport Cost: Under prefect competition, it is assumed that different firms work so close to each other that there is no transport cost for customers.
(vi) Perfect Mobility: There is a free and complete mobility of factors of production. They are free to enter any industry, if considered profitable and leave any industry when remuneration is inadequate.Similarly, there is a perfect mobility of goods.
6.
The supply curve of rice will shift to the left as the farmer would be more willing to sell that good for which he gets a higher price, wheat in this case.
7.
The government uses taxes on alcohol for several purposes, which include an attempt to reduce abuse and harm by making alcohol less accessible; to create trade barriers and to encourage the purchase of domestic products over the imported ones. The effective taxation and pricing policies can be used as a tool for public health and social welfare.
8.
A change in the input prices affects a firm's supply curve. If the price of an input, say, the wage rate of labour increases, the cost of production will also increase. The consequent increase in the firm's Average cost at any level of output is usually accompanied by an increase in the firm's Marginal cost at any level of output. That is, there is a leftward shift of the MC curve. This means that the firm's supply curve shifts to the left. At any given market price, the firm now supplies fewer units of output. In other words, an increase in input prices is expected to shift the supply curve of a firm to the left.
9.
Three factors responsible for a rightward shift of the supply curve of a good are:
(i) A technological advancement
(ii) A fall in the price of input.
(iii) An increase in the number of firms in the market.
10.
Three factors responsible for a rightward shift of the supply curve of a good are:
(i) A technological advancement
(ii) A fall in the price of input.
(iii) An increase in the number of firms in the market.
11.
The supply curve of a firm is a positive function of a state of technology. That is, if the technology available to the firm appreciates, more amount of output can be produced by the firm with the given levels of capital and labour. Due to such innovations or technological advancements, the firm will experience lower cost of production, which will lead to rightward downward shift of the MC curve. This will further lead to rightward shift of the firm’s supply curve. Thus, due to the appreciation and advancement of production techniques, the firm will produce more and more output that will be supplied at a given market price.
12.
Average Revenue is defined as the revenue per unit of the output sold. It is expressed as the ratio between total revenue and the output sold.
\(\mathrm{AR}=\frac{\mathrm{TR}}{Q}\)
We know that
TR = P x Q
\(\mathrm{AR}=\frac{P \times Q}{Q}\)
AR = P
Thus, the market price and the average revenue are the same for a perfect competitive firm.
13.
Price line is the graphical representation of the relationship between output and price, with x- axis denoting the output and y-axis denoting the price. For a perfectly competitive firm, price line and demand curve are the same.
14.
Price elasticity of supply (\(E_{ s }\) may be defined as the degree of responsiveness of quantity supplied of a . good to a change in its price.
Following are the two methods of measuring price elasticity of supply:
(i) Percentage .Method: Price elasticity of supply is measured by taking the ratio of a percentage change in quantity supplied to the percentage change in the price of the good.
\(E_{ s }=\frac { Percentage\quad ChangeinQuantitySupplied }{ PercentageChangeinPrice } \)
\(\\ =\frac { Q_{ 1 }-Q }{ Q } or\frac { \Delta Q }{ \frac { Q }{ \frac { \Delta P }{ P } } x100 } \times100\)
\(\\ =\frac { \Delta Q }{ \frac { Q }{ \frac { \Delta P }{ P } } } =\frac { \Delta Q }{ Q } \times\frac { P }{ \Delta P } \)
\( \\ =\frac { \Delta Q }{ \Delta P } \times\frac { P }{ Q }\)
where, P = Original Price
Q = Original Price
\(p_{ 1 }=New\quad price\)
\(\\ Q_{ 1 }=New\quad supply\)
\(\\ \Delta Q=Change\quad in\quad quantity\quad suplied\)
\(\\ \Delta P=Change\quad in\quad price\)
15.
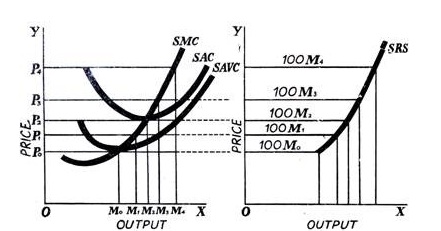
The short-run supply curve of a firm is the rising part of the short-run Marginal Cost (SMC) curve from and above the minimum point of Average Variable Cost (AVC) curve. Zero level of output is produced for all the prices less than the minimum AVC.
Stage 1
When the price is greater than or equal to minimum of SAVC, i.e., P ≥ min SAVC.
At the market price OP, the three following conditions for equilibrium are fulfilled:
MC = MR
MC is upward sloping
Price exceeds the minimum of SAVC
At this market price the firm is producing profit maximising output Oq1.
In this case, the supply curve of the firm is regarded as the upward sloping part of SMC (above the minimum point of SAVC), i.e. SS. When the price is greater than or equal to minimum of SAVC, the supply curve is indicated by SS.
Stage 2
When the price is less than the minimum of SAVC
Let us suppose that the firm is facing price OP1 that is lesser than the minimum of SAVC. At this price, the firm cannot continue production as it cannot even cover up its variable costs and thereby incurs losses, which implies that the firm would produce nothing. Thus, it will incur loss that will be equivalent to its fixed costs. It will be lesser compared to the losses associated with producing any positive output level. Thus, the firm will not produce anything at this price and thereby the quantity supplied will be zero. The firm’s supply curve is indicated by the darkened vertical line S1S1.
Therefore, the short run supply curve of perfect competitive firm is (SS + S1S1).

12th Standard CBSE Syllabus & Materials
12th Standard CBSE
CBSE 12th Computer Science Python Revision Tour I - New Previous year Question Papers Study Material - QB365 Set A
NEW12th Standard CBSE
CBSE 12th Business Studies Planning Important Questions And Answers Study Material - QB365 Set A
NEW12th Standard CBSE
CBSE 12th Business Studies Business Environment Important Questions And Answers Study Material - QB365 Set A
NEW12th Standard CBSE
CBSE 12th Business Studies Principles of Management Important Questions And Answers Study Material - QB365 Set A



CBSE 12th Standard CBSE Subjects
CBSE Standards











