
 100% FREE ACCESS
12th Standard CBSE Syllabus & Materials
12th Standard CBSE
CBSE 12th Economics Government Budget and the Economy Previous year Question Papers Study Material - QB365 Set A
NEW12th Standard CBSE
CBSE 12th Computer Science Interface Python with MySQL - New Previous year Question Papers Study Material - QB365 Set A
NEW12th Standard CBSE
CBSE 12th Computer Science Database Concept - New Previous year Question Papers Study Material - QB365 Set A
NEW12th Standard CBSE
CBSE 12th Computer Science Data Communication - New Previous year Question Papers Study Material - QB365 Set A
NEW12th Standard CBSE
CBSE 12th Computer Science Data Structures - New Previous year Question Papers Study Material - QB365 Set A
NEW12th Standard CBSE
CBSE 12th Computer Science Functions - New Previous year Question Papers Study Material - QB365 Set A

Published on: 15/09/2018
Term Test
Download CBSE Class 12th Standard CBSE undefined question papers, sample papers, important questions, and previous year solved papers in PDF format. Get free study materials, NCERT solutions, and exam preparation resources for Class 12th Standard CBSE undefined
Questions + Answers key
Take MCQ Biology Test
1.
Why do problems related to allocation of resources in an economy arise? Explain
2.
Suppose the price at which equilibrium is attained in excess is above the minimum average cost of the firms constituting the market. Noe if we allow for free entry and exit of firms. how will the market price adjust to it?
3.
Explain how price is determined in a perfectly competitive market with fixed number of firm
4.
What will happen if the price prevailing in the market is:
(i) Above the equilibrium price?
(ii) below the equilibrium price?
5.
What do you understand by normative economic analysis?
6.
What do you understand by positive economic analysis?
7.
Discuss the subject matter of economics.
8.
The price elasticity of demand of a commodity is (-) 1.5 When its price falls by Rs.1 per unit, its quantity demanded rises by 3 units.If the quantity demanded before the price change was 30 units, what was the price at this demand? Calculate.
9.
Consider the demand curve \(D(p)=10-3p\) . what is the elasticity at price \(\frac { 5 }{ 3 } \) ?
10.
Suppose a consumer can afford to buy 6 units of good 1 and 8 units of good 2 if she spends her entire income.The prices of the two goods are Rs.6 and Rs.8 respectively.How much is the consumer's income?
11.
Distinguish between a centrally planned economy and a market economy.
12.
Explain the causes of a leftward shift in the demand curve of a commodity.
13.
Distinguish between the following:
(i) Normal good and inferior good
(ii) Marginal Utility and Total Utility
(iii) Individual demand schedule and market demand schedule
14.
Explain the problem of economic growth.
15.
A consumer consumes only two goods X and Y whose prices are Rs.5 and Rs.4 respectively.If the consumer chooses a combination of the two goods with Marginal Utility of X equal to 4 and that of Y equal to 5, is the consumer in equilibrium?Give reasons.What will a rational consumer do in this situation?Use utility analysis.
16.
How does an increase on excise tax rate affect the market price and the quantity exchanged?
17.
How does a cost-saving technological progress affect the market price and the quantity exchanged?
18.
How does an increase in the price of a substitute good in consumption affect the equilibrium price?
19.
Give the meaning of excess demand for a product
20.
What does the problem for 'whom to produce' refer to?
21.
TU starts diminishing when MU begins to diminish.
22.
In case of perfectly inelastic demand, decrease in supply results in an increase in price and increase in supply leads to a decrease in price
23.
Equilibrium price is the price at which market demand and supply of a commodity match each other
24.
Market equilibrium is a state in which market demand equals market supply
25.
In perfect competition, the slope of supply curve is negative
26.
If Marginal Rate of Substitution is increasing throughout, the indifference curve will be:
Downward sloping convex
Downward sloping concave
Downward sloping straight line
Upward sloping convex
27.
What type of slope does demand curve for Giffen goods have?
Negative
Positive
Normal
None of these
28.
What are the type of goods whose demand increases with the increase in income?
Normal goods
Inferior goods
Giffen goods
All of these
29.
Marginal Utility=
\(\frac { \Delta TU }{ \Delta Q } \)
\({ TU }_{ n }-{ TU }_{ n-1 }\)
Both(A) and (B)
None of these
30.
Want satisfying power of a commodity is known as________________.
Consumption
Production
Exchange
Utility
31.
Economics is a ______ science.
Natural
Economic
Social
Political
32.
The main cause of economic problems is ________.
Scarcity
Abundance
Saving
Profit
33.
Who has developed the FAD theory?
Prof. Amartya sen
Samuelson
Harrod
Adam smith
34.
What is the relationship between demand and supply in the support price process?
Demand>supply
Demand
Demand=supply
None of these
35.
What is the relationship between demand and supply in the controlled prices?
Demand
Demand>supply
Demand=supply
All of these
1.
The problems related to allocation of resources in an economy arise because of the unlimited wants of people. The resources used to produce goods and services are limited or scarce. Resources are not only scarce but they have alternative use also. Thus, scarcity of resources leads to the problems related to allocation of resources in an economy.
2.
If there are a free entry and exit of firms in the market, the equilibrium price is always equal to the minimum average cost of the firm. That is, equilibrium price;
P=min AC
If the market price is above the minimum average cost, It means that firms are making supernormal profits. The possibility of earning a supernormal profit will attract some new firms, which will lead to a reduction in super normal profit will be wiped out. At this point, with all firms in the market earning only normal profit, no more firms will have the incentives to enter.
If the market price is below the minimum average cost, It means that firms are making losses. since the firms are earning less than the normal profit at the prevailing price, some firms will exit, which will lead to an increase in profit. once a sufficient number of firms have left the market. The profit of each firm will increase to a level of normal profit, at this point, no firm will leave since they are earning normal profits, thus, with free entry and exit, each firm will always earn normal profit at the prevailing market price
3.
Supply and demand determine the equilibrium price competitive market with fixed number of the firm. The equilibrium price is obtained at the intersection of the market demand and market supply curves.
In given figure, equilibrium occurs at the intersection of the market demand curve (DD) and the market supply curves (SS). The equilibrium quantity is Q* and the equilibrium price is P*. At a price greater than \(P \times ({ P }_{ 2 }>P).\) there will be an excess supply and at a price below \(P \times({ P }_{ 1 }>P).\) there will be an excess demand.
4.
(i) if the price prevailing in the market is above the equilibrium price, it implies that there is an excess supply of a good. excess supply refers to a situation when quality demanded is less than the quality supplied at given prices. It creates competition among the sellers and causes the prices to fall. marginal sellers will leave the market leading to falling in supply. This fall in supply will continue up to the point where it is equal to the market demand
(ii) if the price prevailing in the market is below the equilibrium price, it implies that there is an excess demand for a good. excess demand refers to a situation when quality demanded is more than the quality supplied at given prices. It creates competition among the buyers and pushes the prices up. New firm will enter the market leading to an increasing in supply. This increase in supply will continue up to the point where it is equal to the market demand
5.
Normative economic analysis discusses the economics of 'what ought to be'. In normative economic analysis, the desirability of different mechanisms is checked and recommendations are prescribed for making corrections, if necessary.
6.
Positive economic analysis discusses the economics of 'what is'. In positive economic analysis, the functioning of different mechanisms is analysed and their respective outcomes are figured out for refernce in future.
7.
The subject matter of economics has been studied under two broad branches:
(i) Microeconomics
(ii) Macroeconomics
In microeconomics we study the behaviour of individual decision-making units, such as households and firms. Equilibrium prices and quantities of goods and services are determined through the interaction of individuals in the markets.
In macroeconomics, we study the behaviour of factors affecting the economy as a whole. It focuses on the behaviour of national level aggregates such as national income, total output, employment level, price level, etc. Here, we are interested in finding out how thelevels of these aggregate measures are determined and how these measures change over time.
8.
Price elasticity of. demand is calculated as:
\({ E }_{ D }=\frac { \triangle Q }{ \triangle P } \times \frac { P }{ Q } \)
Original Price; P = ?
Original Quantity Demanded; Q = 30
Change in Price; \(\triangle \) P = (-) 1
Change in Quantity Demanded; \(\triangle \)Q = 3
Price elasticity of demand is ED = (-) 1.5
By Substituting appropriate values in (I); we get
(-)1.5 = \(-\frac { 3 }{ 1} \times \frac { P }{ 30 }\)
P = 15
Therefore, the price before change was Rs.15 per unit.
9.
Elasticity of demand (ED) along with linear demand curve is calculated as:
\({ E }_{ D }\ =-b\frac { P }{ Q } \ = -\frac { bp }{ a-bp } \)
In the given demand curve, a = 10 and -b = 3.
At \(p=\frac { 5 }{ 3 } ;\)
\({ E }_{ D }\ =\ -\frac { 3\times \frac { 5 }{ 3 } }{ 10-\left( 3\times \frac { 5 }{ 3 } \right) } \)
\(=\ -\frac { 5 }{ 10-5 } \ =\ -\frac { 5 }{ 5 } \ =\ -1\)
The price elasticity of demand is ED = -1. The demand for the good is unit elastic.
10.
A budget line is given by an equation:
Here M = P1 X1 + P2 X2
P1 = Rs.6
X1 = 6
P2 = Rs. 8
X = 8
M = ?
Substituting appropriate values in (I), we get:
M = Rs.6(6) + Rs.8(8)
= Rs.36 + Rs.64
= Rs.100
Thus, the consumer's income is Rs.100.
11.
Following are the points of distinction between centrally planned economy and market economy:
| S.No. | Centrally Planned Economy | Market Economy |
|---|---|---|
| 1. | Economic activities are planned by the government or the central authority in the economy. | The economic activities are managed through the market. |
| 2. | The central authority is the only owner of the resources and is soley engaged in the production and distribution of goods and services. | Prices of goods and services are determined by market forces of demand and supply with minimum intervention by the government. |
| 3. | Primary motive of a centrally planned economy is social welfare. | Profit is the primary motive of the market economy. |
| 4. | Economic planning solves the central problems of the centrally planned economy. | Price signals solve central problems of the market economy. |
12.
Following are the causes of a leftward shift in the demand curve:
(i) Decrease in the Prices of Substitute Goods: Substitute goods are those goods which can be used in place of one another, such as tea and coffee, or ballpoint pen and ink pen. If X and Y are substitutes then a decrease in the price ofY will decrease the demand for the X as latter is relatively expensive now. The consumer will substitute Y for X, and the demand curve for X shifts to the left.
(ii) Increase in the Prices of Complementary Goods: Complementary goods are those goods which are always consumed together to satisfy a particular need or wartt. If goods X and Yare complements, an increase in the price ofY contracts its demand, and thus, decreases, the demand for X. The demand curve for X shifts to the left.
(iii) Fall in Income: With a fall in income, the consumer is capable of buying less. Thus, a fall in income decreases the demand for normal goods at a given price, and the demand curve shifts to the left.
(iv) Negative Change in Hobbies: Tastes and preferences of consumer also affect the demand for a good. With the negative changes in hobbies, the consumer's demand for a good decreases, which shifts the demand curve towards the left.
13.
(i) Normal goods are those goods the demand for which increases as income increases, and decreases as income decreases. In other words, we buy more of these goods as our income increases. The demand curve for normal goods is positively sloped . On the other hand, inferior goods are those goods the demand for which decreases as income increases, and increases as income decreases. The demand curve for inferior goods is negatively sloped.
(ii) Total Utility is the total satisfaction derived from the consumption of all the units of a good. Marginal Utility, on the other hand, is the additional utility derived from the consumption of one more unit of the good. Marginal Utilities of all units of consumption are added to derive Total Utility.
(iii) Individual demand schedule shows different quantities of a good demanded by an individual consumer or household corresponding to different prices. Market demand schedule, on the other hand, shows total demand for a good by all the consumers in the market corresponding to different prices. Market demand schedule is obtained by summing the quantities demanded by all the individuals at different prices.
14.
Production Possibility Curve (PPC) is the graph depicting all the possible combinations of two goods that can be produced in an economy by making an efficient and full utilisation of all the resources and given state of technology. Economic growth due to technological advancement or growth of resources increases the economy's capacity to produce. Many combinations, which were unattainable earlier can be attained now. As a result PPC, shifts to the right. The impact of economic growth can be shown with the help of the following diagram:
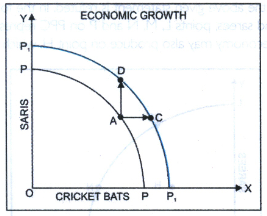
The Production Possibility Curve shifts outward to the right from PP to \({ P }_{ 1}{ P }_{ 1 }\)due to economic growth. The economy's production capacity increases from point A to point B or C.
15.
Consumer's equilibrium refers to a situation in which the consumer maximises his or her satisfaction given the income and the market prices. Consumer's equilibrium is attained when the ratio of the Marginal Utility of good X to price of X is-equal to the ratio of the Marginal Utility of good Y to price of Y. That is, when
\(\frac { { MU }_{ X } }{ { P }_{ X } } =\frac { { MU }_{ Y } }{ { P }_{ Y } } \)
In the given question:
\(\frac { { MU }_{ Y } }{ { P }_{ Y } } =\frac { 4 }{ 5 } =0.8\)
And; \(\frac { { MU }_{ X } }{ { P }_{ X } } =\frac { 5 }{ 4 } =1.25\)
That is, \(\frac { { MU }_{ X } }{ { P }_{ X } } \ >\ \frac { { MU }_{ Y } }{ { P }_{ Y } } \). Thus, the consumer is not in equilibrium.
A rational consumer would transfer expenditure from good X to good Y till \(\frac { { MU }_{ X } }{ { P }_{ X } } =\frac { { MU }_{ Y } }{ { P }_{ Y } } \)
16.
()
An increase on excise tax rate leads to an increase in the market price and the quantity exchanged
17.
()
A cost-saving technological progress leads to a fall in the market price and the quantity exchanged.
18.
()
An increase in the price of a substitute good in consumption leads to an increase in the equilibrium price
19.
()
Excess demand refers to a situation when consumers want more than what producers are willing to supply at given prices. excess demand creates competition among buyer and pushes the price up
20.
()
The problem of 'for whom to produce' refer to how all the final goods and services are to be distributed among different consumers.
21.
(b)
22.
(a)
23.
(a)
24.
(a)
25.
(b)
26.
(b)
Downward sloping concave
27.
(b)
Positive
28.
(a)
Normal goods
29.
(c)
Both(A) and (B)
30.
(d)
Utility
31.
(c)
Social
32.
(a)
Scarcity
33.
(a)
Prof. Amartya sen
34.
(b)
Demand
35.
(b)
Demand>supply

12th Standard CBSE Syllabus & Materials
12th Standard CBSE
CBSE 12th Computer Science Python Revision Tour I - New Previous year Question Papers Study Material - QB365 Set A
NEW12th Standard CBSE
CBSE 12th Business Studies Planning Important Questions And Answers Study Material - QB365 Set A
NEW12th Standard CBSE
CBSE 12th Business Studies Business Environment Important Questions And Answers Study Material - QB365 Set A
NEW12th Standard CBSE
CBSE 12th Business Studies Principles of Management Important Questions And Answers Study Material - QB365 Set A



CBSE 12th Standard CBSE Subjects
CBSE Standards











