
 100% FREE ACCESS
12th Standard CBSE Syllabus & Materials
12th Standard CBSE
CBSE 12th Economics Government Budget and the Economy Previous year Question Papers Study Material - QB365 Set A
NEW12th Standard CBSE
CBSE 12th Computer Science Interface Python with MySQL - New Previous year Question Papers Study Material - QB365 Set A
NEW12th Standard CBSE
CBSE 12th Computer Science Database Concept - New Previous year Question Papers Study Material - QB365 Set A
NEW12th Standard CBSE
CBSE 12th Computer Science Data Communication - New Previous year Question Papers Study Material - QB365 Set A
NEW12th Standard CBSE
CBSE 12th Computer Science Data Structures - New Previous year Question Papers Study Material - QB365 Set A
NEW12th Standard CBSE
CBSE 12th Computer Science Functions - New Previous year Question Papers Study Material - QB365 Set A

Published on: 05/08/2019
Determination of Income and Employment
Download CBSE Class 12th Standard CBSE undefined question papers, sample papers, important questions, and previous year solved papers in PDF format. Get free study materials, NCERT solutions, and exam preparation resources for Class 12th Standard CBSE undefined
Questions + Answers key
Take MCQ Biology Test
1.
Full employment implies absence of:
Voluntary unemployment
Involuntary unemployment
Unemployment
None
2.
When the value of MPC is 0.7, the value of MPS will be:
0.3
1.0
Zero
0.8
3.
Out of the following which value can be greater than one?
APC
MPC
APS
MPS
4.
In case of excess demand, RBI ............... the bank rate or interest rate which makes the credit dear.
increases
decreases
deposit
None of these
5.
Investment is an addition to_______
supply
current stock
capital stock
None of these
6.
Show a point on the consumption curve at which APC= 1.
7.
In poor countries like India, people spend a high percentage of their income so that APC and MPC are high. Yet, value of multiplier is low. Why?
8.
What happens if AD > AS prior to full employment level of employment?
9.
Complete the following table:
| Income | Marginal Propensity to Consume | Saving | Average Propensity to Save |
| 0 | - | -90 | - |
| 100 | 0.6 | ... | ... |
| 200 | 0.6 | ... | ... |
| 300 | 0.6 | ... | ... |
10.
Calculate investment expenditure from the following data about an economy which is in equilibrium:
National Income=1000
Marginal Propensity to Save=0.25
Autonomous Consumption expenditure=200
11.
Complete the following table:
| Income(Rs.) | Consumption Expenditure(Rs.) | Marginal Propensity to Save(MPS) | Average Propensity to Save (APS) |
| 0 | 80 | - | - |
| 100 | 140 | 0.4 | ... |
| 200 | ... | ... | 0 |
| ... | 240 | ... | 0.20 |
| ... | 260 | 0.8 | 0.35 |
12.
Distinguish between inflationary gap and diflationary gap. State one measure for each, by which these can be corrected.
13.
If MPS = 0.3, what will be MPC?
14.
What are the limiting values of MPC?
15.
What is the relation between MPC and MPS?
16.
What is the relationship between APC and APS?
17.
Given the Consumption function: C = 100 + 0.06 Y, what will be the value of autonomous consumption.
18.
If national income is Rs. 50 crore and saving is Rs.5 crore, find out average propensity to consume. When income rises to Rs. 60 crore and saving to Rs.9 crore, what will be the average propensity to consume and the marginal propensity to save?
19.
Form the consumption function, determine the volume of consumption expenditure from the following:
Autonomous consumption = Rs50
Marginal Propensity to consume = 0.80
National Income = Rs.500
20.
Explain the consumption function with the help of schedule and diagram.
21.
State the meaning and components of aggregate demand.
22.
Explain the role of margin requirements for correcting the deflationary gap.
23.
What is 'deficient demand'? Explain the role of 'Margin Requirements' in
removing this gap.
24.
Explain the equilibrium level of income with the help of saving and investment curves. If savings exceed planned investment, what changes will bring about the equality between them?
25.
Draw a hypothetical propensity to consume curve and from it draw the propensity to save curve.
1.
(b)
Involuntary unemployment
2.
(a)
0.3
3.
(a)
APC
4.
(a)
increases
5.
capital stock
6.
APC = C/Y = 1 is possible if C = Y, i.e. Consumption is equal to Income.
7.
Working of the multiplier process is based on one fundamental assumption: that there exists, excess capacity in the economy, so that whenever consumption expenditure rises (implying increase in demand ) there is a corresponding increase in production (implying increase in income). But poor countries like India, lack in production capacity. Accordingly, whenever demand increases (in terms of increase in consumption expenditure), there is increasing pressure of demand on the existing output (implying inflation or rise in prices) rather than the increase in output or income.
8.
It is a state of disequilibrium in economics. When AD > AS, producers have to cater to demand out of their existing stock of goods, implying that the desired level of stocks will decrease. It implies greater production & therefore there is increase in AS. This process continues till equilibrium is struck between AD and AS.
9.
S=Y-C, APS=S/Y
| Income(Y) | MPC | MPS | Saving(S) | APS |
| 0 | - | - | -90 | - |
| 100 | 0.6 | 0.4 | 40 | 0.4 |
| 200 | 0.6 | 0.4 | 80 | 0.4 |
| 300 | 0.6 | 0.4 | 120 | 0.4 |
10.
Y=1000, MPS=0.25, \(\overline { C } \)=200
MPC or b=1-MPS=1-0.25=0.75
\(C=\overline { C } +bY,\) C=200+0.75\(\times \)1000, C=950
We know, Y=C+I, 1000=950+I,
I=1000-950 =50
11.
Y=C+S,
S=Y-C,
\(MPS=\frac { \Delta S }{ \Delta Y } ,\quad \quad APS=\frac { S }{ Y } \)
| Income (Y) (Rs.) | Consumption expenditure (C) (Rs.) | Saving(S) | \(\Delta S\) | \(\Delta Y\) | \(MPS=\frac { \Delta S }{ \Delta Y } \) | \(APS=\frac { S }{ Y } \) |
| 0 | 80 | -80 | - | - | - | - |
| 100 | 140 | -40 | 40 | 100 | 0.4 | -0.4 |
| 200 | 200 | 0 | -40 | 100 | -0.4 | 0 |
| 300 | 240 | 60 | 60 | 100 | 0.6 | 0.20 |
| 400 | 260 | 140 | 80 | 100 | 0.8 | 0.35 |
12.
The excess of Aggregate Demand above the level required to maintain equilibrium in full employment situation in an economy is termed as inflationary gap. It causes inflation and increases price levels in an economy. When there is involuntary unemployment in the economy, there is a short fall in Aggregate Demand from the level required to maintain a full employment equilibrium. This short fall is termed as deflationary gap. It causes reduction in prices in the economy. Inflationary and deflationary gap can be corrected by opting following means:
(i) To correct the inflationary gap, government should form fiscal and monetary policy to close the gap. Monetary policy can be used in such a manner that it will contract the money supply in the economy by raising interest rates and opts the method of progressing taxation.
(ii) To correct the deflationary gap, government should stood doing the additional expenditure equal to deflationary gap, so that deflationary gap is wiped out.
13.
()
If MPS = 0.3, then MPC = 1 - 0.3 = 0.7
14.
()
The value of MPC cannot be greater than 1. Its value can vary from zero to one.
15.
()
The sum of MPC and MPS is always equal to one, i.e., MPC + MPS = 1.
16.
()
The sum of the APC and APS is always equal to one, i.e., APC + APS = 1.
17.
()
Value of autonomous consumption will be Rs.100.
18.
(i) APC = \(\frac { C }{ Y } \), where C = Y-S
= 50-5 = 45 = \(\frac { 15 }{ 50 } \) = 0.90
(ii) APC = \(\frac { C }{ Y } \) =\(\frac { 51 }{ 60 } \) = 0.85
where C = Y - S = 60-9 = 51
(iii) MPS = \(\frac { \triangle S }{ \triangle Y } \) = \(\frac { 4 }{ 10 } \) = 0.40
19.
C = \(\bar { C } \) + MPC (Y)
= 50 + (0.80 x 500) = 50 + 400 = Rs.450
20.
Consumption function shows the relationship between consumption and income.
C = f (Y)
This equation states that there is a direct relation between consumption and the level of income. As the level of income increases, consumption also increases but the increase in consumption is less than the increase in income. The concept of consumption function can be further explained by following consumption schedule and curve:
| Income | Consumption (Rs. crores) |
| 0 | 50 |
| 100 | 100 |
| 200 | 150 |
| 300 | 200 |
| 400 | 250 |
| 500 | 300 |
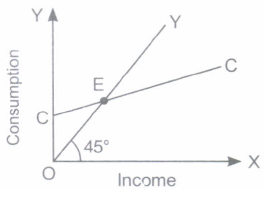
The above table and diagram show that as the income increases, consumption
also increases but the increase in consumption is less than increase in income.
21.
Aggregate demand represents the planned expenditure on final goods and services in an economy during a period of time.
There are four components of aggregate demand (AD):
(i) Private Consumption Expenditure (C). It is the most important component of aggregate demand. It refers to the total amount of expenditure incurred by the households on the purchase of final goods and services to satisfy their wants.
(ii) Investment Expenditure (I). It refers to the expenditure incurred by the private firms on the purchase of capital goods such as plant and equipment, construction work, etc.
(iii) Government Expenditure (G). It refers to the expenditure incurred by the government on the purchase of final goods and services. The level of government expenditure is determined by the government's policy.
(iv) Net Exports. Net exports is the difference between exports and imports. It shows the effect of domestic spending on foreign goods and services (Imports) and foreign spending on domestic goods and services (Exports).
22.
Deflationary gap refers to a situation when at full employment level of income AD falls short of AS. It is called deficient demand.
Margin requirements refers to the margin on the security provided by the borrower. When margin is lower, the borrowing capacity of the barrover is higher. When central bank lowers the margin the borrowing capacity of the borrowers increase. This raise AD.
23.
(i) Decrease in bank rate: For controlling deficient demand, the Central bank should decrease the bank rate. A decrease in bank rate lowers the rate of interest and credit becomes cheaper. Accordingly, the demand for credit expands and aggregate demand increases.
(ii) Purchase of Government Securities: For controlling deficient demand, the Central bank should resort to buying of government securities. By buying the government securities, the Central bank injects additional purchasing power in the system which results in the expansion of credit. As a result, aggregate demand increases.
(iii) Reduction in cash reserve ratio: For controlling deficient demand, the Central bank should reduce the cash reserve ratio with a view to increasing the flow of credit. As a result, aggregate demand increases.
(iv) Lower the Margin Requirements: To correct the situation of deficient demand' in an economy the central bank can lower minimum margin requirements in case of selected commodities, against which the commercial bank advance loans. This in turn will raise the capacity to borrow of the borrowers. They will now borrow more, thereby AD will increase and situation of deficient demand be corrected.
(v) Increase in government expenditure during a situation of deficient demand: There is a need for the government's expenditure to be increased. This.increase in expenditure will directly increase AD and thereby be helpful in closing the deflationary gap in the economy.
24.
The equilibrium level of income is determined at a point where savings and
investment are equal, i.e., S = 1. The given table and diagram illustrate the
determination:
| Income (Y) | Consumption (C) | Saving (S) = Y - C | Investment (Rs. crores) (1) |
| 0 | 50 | -50 | 100 |
| 100 | 100 | 0 | 100 |
| 200 | 150 | 50 | 100 |
| 300 | 200 | 100 | 100 |
| 400 | 250 | 150 | 100 |
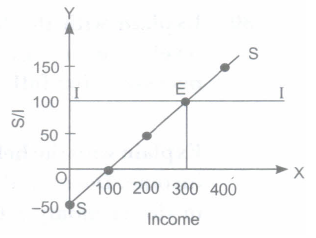
The table and diagram show that the equilibrium level of income is Rs.300
crores and at this point S(100) = I (100).
When savings exceed planned investment. It means that people are consuming less and thereby spending less. As a result, aggregate demand is less than aggregate supply. This will lead to the accumulation of unintended inventories with businessmen. To avoid further accumulation of inventories, businessmen will reduce production. Consequently, output, income, and employment will be reduced to the equilibrium level of income OY (~ 300 crores) is reached where S = I.
25.
The steps involved in the derivation of the saving curve from the consumption
curve are:
(i) We can find savings at different levels of income by taking the vertical distance between the CIS consumption curve (CC)and the 45° line.
(ii) At point B in the diagram income and consumption expenditure are equal Y = C, i.e., savings are zero.
(iii) To the left of point B, CC curve is higher than the 45° line, which denotes income. This implies savings are negative (or Dissaving)to the left of point B, in the diagram.
(iv) To the right of point B, CC curve is lower than the 45° line, this implies C < Y and savings are positive.
(v) By plotting the distance between the CC curve and 45° line at different levels of income just below the upper part we can derive the saving curve SS'. Since the CC curve is a straight line, the derived savings curve \(\rightarrow \) SS, must also be a straight line. For this we are required to locate only 2 points.
(a) Plot a perpendicular <-F)from point Bon the consumption curve, intersecting the OX axis, at point D, which must be on the OX axis, because savings is zero when Y = C.
(b) Plot as on the lower part of OY axis as equal to OC on the Y axis on the upper part. This gives us point S, from where the saving curve will start.
(vi) Joining points Sand Dand extending the straight line upwards we derive the savings curve SDS.

12th Standard CBSE Syllabus & Materials
12th Standard CBSE
CBSE 12th Computer Science Python Revision Tour I - New Previous year Question Papers Study Material - QB365 Set A
NEW12th Standard CBSE
CBSE 12th Business Studies Planning Important Questions And Answers Study Material - QB365 Set A
NEW12th Standard CBSE
CBSE 12th Business Studies Business Environment Important Questions And Answers Study Material - QB365 Set A
NEW12th Standard CBSE
CBSE 12th Business Studies Principles of Management Important Questions And Answers Study Material - QB365 Set A



CBSE 12th Standard CBSE Subjects
CBSE Standards











