
 100% FREE ACCESS
12th Standard CBSE Syllabus & Materials
12th Standard CBSE
CBSE 12th Economics Government Budget and the Economy Previous year Question Papers Study Material - QB365 Set A
NEW12th Standard CBSE
CBSE 12th Computer Science Interface Python with MySQL - New Previous year Question Papers Study Material - QB365 Set A
NEW12th Standard CBSE
CBSE 12th Computer Science Database Concept - New Previous year Question Papers Study Material - QB365 Set A
NEW12th Standard CBSE
CBSE 12th Computer Science Data Communication - New Previous year Question Papers Study Material - QB365 Set A
NEW12th Standard CBSE
CBSE 12th Computer Science Data Structures - New Previous year Question Papers Study Material - QB365 Set A
NEW12th Standard CBSE
CBSE 12th Computer Science Functions - New Previous year Question Papers Study Material - QB365 Set A

Published on: 20/08/2019
Market Equilibrium
Download CBSE Class 12th Standard CBSE undefined question papers, sample papers, important questions, and previous year solved papers in PDF format. Get free study materials, NCERT solutions, and exam preparation resources for Class 12th Standard CBSE undefined
Questions + Answers key
Take MCQ Biology Test
1.
When do we say there is excess supply for a commodity in the market?
2.
When do we say there is excess demand for a commodity in the market?
3.
Explain market equilibrium.
4.
Give the meaning of excess supply of a product
5.
Give the meaning of excess demand for a product.
6.
Define market equilibrium
7.
Define equilibrium.
8.
Define equilibrium price.
9.
Explain the process of determination of equilibrium price under perfect competition with the help of suitable table and diagram.
10.
Market for a good is in equilibrium. The supply of good 'decreases'. Explain the chain of effects of this change.
11.
Market for a commodity is in equilibrium. Demand for the commodity 'increases'. Explain the chain of effects of this change till the market again reaches equilibrium. Also compare prices at old and new equilibrium
12.
Market of a commodity is in equilibrium. Demand for the commodity 'increases'. Explain the chain of effects of the change till the market again reaches equilibrium. Use diagram.
13.
Suppose the price of a good is higher than the equilibrium price. Explain the changes that will establish equilibrium price.
14.
If at a given price of a commodity there is excess supply, how will the equilibrium price be reached? Explain with the help of a diagram.
15.
Equilibrium quantity is that quantity at which quantity demanded is greater than quantity supplied.
16.
Equilibrium price is the price at which demand and supply of a commodity match each other.
17.
Market equilibrium is a state in which market demand equals market supply.
18.
In perfect competition, the slope of demand curve is positive.
19.
In perfect competition, the slope of supply curve is negative.
20.
When demand decreases and supply is perfectly inelastic, what will the effect on equilibrium price?
Decrease
Increase
Constant
None of these
21.
What will the effect be on equilibrium price due to more decrease in demand than supply?
Decrease
Constant
Increase
None of these
22.
When does the normal price determine?
Very short run
Short run
Long run
All of these
23.
Who has developed the FAD Theory?
Prof. Amartya Sen
Samuelson
Harrod
Adam Smith
24.
What is the effect of excess supply on market price?
It will decrease
It will increase
It will be constant
It will zero
1.
Excess supply is a situation when the supply of a commodity in the market exceeds its demand at a particular price. In other words, if at any price level, all the consumers demand comparatively less quantity than what is being supplied by all the suppliers, then we face the situation of excess supply.
2.
When the market demand exceeds the market supply at a particular price, then the situation that arises is excess demand. In other words, if at any price, the producers are willing to supply comparatively less than what is demanded by all the consumers in the market, then we face the situation of excess demand.
3.
Market equilibrium is defined as the state of rest that is determined by the rational objectives of the consumers and the producers (i.e. maximisation of satisfaction and profit respectively). It is a state where the aggregate quantity that all the firms want to sell are purchased by consumers, i.e. market supply equals market demand. At this situation, there is no incentive or tendency for any change in quantity demanded, quantity supplied and price. That is: yd = ys
4.
()
Excess supply to a situation when quantity demanded is less than the quantity supplied at given prices. It creates competition among the sellers and causes the price to fall.
5.
()
Excess demand refers to a situation when consumers want more than what producers are willing to supply at given prices. Excess demand creates competition among buyers and pushes the price up.
6.
()
Market is said to be in equilibrium when market supply is equal to the market demand. At equilibrium, there is no tendency for price or quantity to change, There is no excess demand or excess supply at equilibrium.
7.
()
Equilibrium refers to the state of rest. It is a position from which there is no net tendency to move.
8.
()
Equilibrium price is the price at which the quantity demand is equal to the quantity supplied. It is obtained at the point of intersection of demand and supply curves.
9.
Equilibrium price is determined where market demand and market supply are equal. We can show this by the following table
| Price (Rs per unit) | Demand (Units) | Supply (Units) | Price Trend |
|---|---|---|---|
| 1 | 100 | 0 | Rising |
| 5 | 60 | 40 | Rising |
| 8 | 50 | 50 | Neutral |
| 10 | 30 | 60 | Falling |
| 20 | 0 | 100 | Falling |
In the table, when', the price of the good is very less, i.e. Rs 1 per unit then its demand is very high (100 units). However, no seller is ready to sell on this price and hence, supply is zero. Excess demand creates competition among the buyers and pushes the price up. When price is Rs 5 per unit, the quantity demanded is 60 units while quantity supplied is 40 units. Again, there is excess demand by 20 units. Price would continue to increase. When price is Rs 8 per unit, the quantity demanded is equal to the quantity supplied at 50 units. This price is called Equilibrium Price.
Similarly, when the price of the good is Rs 20 per unit then its supply is very high (100 units). However, no buyer is ready to buy on this price and hence, demand is zero. Excess supply Creates competition among the sellers and pulls the price down. When price is Rs 10 per unit, the quantity supplied is 60 units while quantity demanded is 30 units. Again, there is excess supply by 30 units. Price would continue to fall.
10.
The main causes of a decrease in supply include. rise in input prices, technological degradation, government policy (taxes), etc. The chain of effects of a decrease in supply can be explained with the help of the following figure:
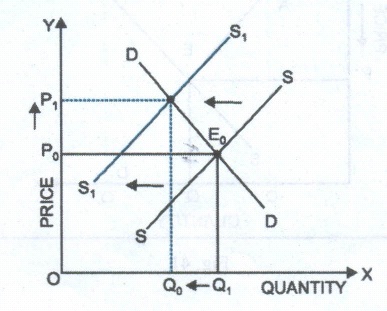
Decrease in supply implies that less quantity is being supplied at the given price. The supply curve will shift to the left from SS to S1S1 This creates excess demand (EA) at price OP0 . Excess demand creates competition among the buyers and pushes price up. Rise in price decreases the quantity demanded (from E to E1) and increases the quantity supplied (from A to E1).These changes continue till price rises to OP1 . OP1 is the new equilibrium price and OQ1 is the new equilibrium quantity.
11.
Market for a good is in equilibrium only when the demand for the good is equal to the supply of the good The main causes of an increase in demand include increase in the prices of substitute goods, decrease in the prices of complementary goods, increase in income and positive changes in hobbies.The chain of effects of an increase in demand can be explained with the help of the following numerical example:
| Price(Rs) | Demand for the Good | Supply of the Good | Excess Demand (Demand-Supply) |
| 5 | 50 | 50 | 0 |
| 5 | 80 | 50 | 30 |
| 6 | 75 | 60 | 15 |
| 7 | 70 | 70 | 0 |
In the table above, the market is in equilibrium at price of Rs 5. At this price quantity demanded is equal to the quantity supplied at 50 units. Suppose at the price of Rs 5, demand increases from 50 to 80 units (say, due to increase in consumers' income), while supply remains the same at60 units. This gives rise to a excess demand of 30 units (80 - 50). Excess demand creates competition among the buyers and pushes the price 'up. The price, therefore, increases from Rs 5 to Rs 6. A rise in price induces the buyers to buy less, and thus, decreases the quantity demanded from 80 to 75 units. Also, arise in price induces the sellers to sell more, and thus, increases the quantity supplied from 50 to 60 units. These changes continue till price rises to Rs 7, where quantity demanded is again equal to the quantity supplied at 70 units. Thus, the new equilibrium price and quantity are Rs 7 and 70 units respectively. Both equilibrium price and equilibrium quantity have increased.
12.
The main causes of an increase in demand curve include increase in the prices of substitute goods, decrease in the prices of complementary goods, increase in income and positive changes in hobbies An increase in the demand or a rightward shift in the demand curve leads to the situation of excess demand at the given price. Excess demand creates competition among the buyers and pushes price up. Thus, an increase in demand increases both the equilibrium price and the equilibrium quantity.
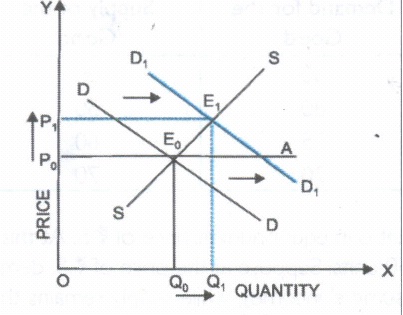
In the diagram, when the demand curve shifts rightwards from DD to D1D1 excess demand is created (E0A) at price OP0 Since there is competition among the buyers due to shortage of good, the price will increase. Increase in price decreases the quantity demanded (from A to E1) and increases the quantity supplied (from E0 to E1) These changes continue till price rises to OP1 . OP1 is the new equilibrium price and OQ1 is the new equilibrium quantity.
13.
When the given price of a good is higher than the equilibrium price; there will be an excess supply of the good. The equilibrium price can be attained by reaching the point of interaction between market demand and supply curves. This can be explained with the help of the given diagram.
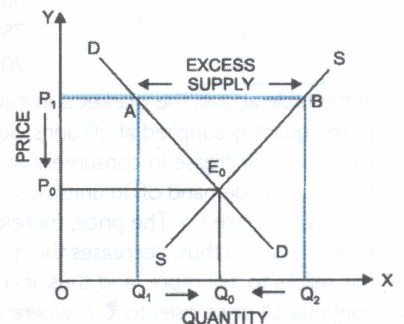

In This diagram, quantity is shown on X axis and price is shown on Y-axis. SS is the supply curve and DD is the demand curve. At the initial price of OP1 , the quantity demanded is less than the quantity supplied (OQ1
14.
When the given price of a good is higher than the equilibrium price; there will be an excess supply of the good. The equilibrium price can be attained by reaching the point of interaction between market demand and supply curves. This can be explained with the help of the given diagram.
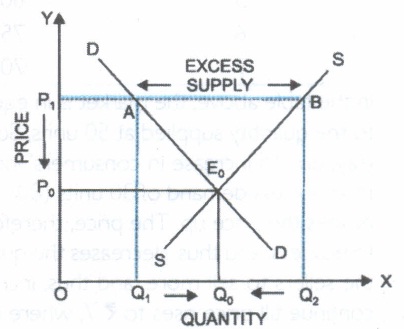
In This diagram, quantity is shown on X axis and price is shown on Y-axis. SS is the supply curve and DD is the demand curve. At the initial price of OP1 , the quantity demanded is less than the quantity supplied (OQ1
15.
(b)
16.
(a)
17.
(a)
18.
(b)
19.
(b)
20.
(a)
Decrease
21.
(a)
Decrease
22.
(c)
Long run
23.
(a)
Prof. Amartya Sen
24.
(a)
It will decrease

12th Standard CBSE Syllabus & Materials
12th Standard CBSE
CBSE 12th Computer Science Python Revision Tour I - New Previous year Question Papers Study Material - QB365 Set A
NEW12th Standard CBSE
CBSE 12th Business Studies Planning Important Questions And Answers Study Material - QB365 Set A
NEW12th Standard CBSE
CBSE 12th Business Studies Business Environment Important Questions And Answers Study Material - QB365 Set A
NEW12th Standard CBSE
CBSE 12th Business Studies Principles of Management Important Questions And Answers Study Material - QB365 Set A



CBSE 12th Standard CBSE Subjects
CBSE Standards











