
 100% FREE ACCESS
12th Standard CBSE Syllabus & Materials
12th Standard CBSE
CBSE 12th Economics Government Budget and the Economy Previous year Question Papers Study Material - QB365 Set A
NEW12th Standard CBSE
CBSE 12th Computer Science Interface Python with MySQL - New Previous year Question Papers Study Material - QB365 Set A
NEW12th Standard CBSE
CBSE 12th Computer Science Database Concept - New Previous year Question Papers Study Material - QB365 Set A
NEW12th Standard CBSE
CBSE 12th Computer Science Data Communication - New Previous year Question Papers Study Material - QB365 Set A
NEW12th Standard CBSE
CBSE 12th Computer Science Data Structures - New Previous year Question Papers Study Material - QB365 Set A
NEW12th Standard CBSE
CBSE 12th Computer Science Functions - New Previous year Question Papers Study Material - QB365 Set A

Published on: 25/05/2021
QB365 Provides the updated NCERT Examplar Questions for Class 12 Biology, and also provide the detail solution for each and every ncert examplar questions , QB365 will give all kind of study materials will help to get more marks
Download CBSE Class 12th Standard CBSE Biology question papers, sample papers, important questions, and previous year solved papers in PDF format. Get free study materials, NCERT solutions, and exam preparation resources for Class 12th Standard CBSE Biology
Questions + Answers key
Take MCQ Biology Test1.
A population od Paramecium caudatum was grown in a culture medium. After 5 days the culture medium became overcrowded with Paramecium and had depleted nutrients.
What will happen to the population and what type of growth curve will the population attain?Draw the growth curve.
2.
The following diagrams are the age pyramids of different populations. Comment on the status of these populations.

3.
(i) List the different attributes that a population has and not an individual organism.
(ii) What is population density? Explain any three different ways the population density can be measured, with the help of an example each.
4.
Ramesh visited a National Park on a school trip where he saw tiger eating a deer. He got disturbed and asked his teacher why is he doing so. His teacher replied that it is natural population controlling phenomenon.
(i) Which type of interspecific interaction is found between tiger and deer?
(ii) State the role of predators
(iii) What other type of population interaction are seen in nature?
(iv) State the values of Ramesh towards animals
5.
Himani while watching a TV programme based on life in polar region observed that all animals in polar regions possess larger size. Also, smaller animals are not found in that region. She asked about this surprising fact to her teacher.
(i) why smaller animals (e.g. humming birds) are rarely found in polar regions?
(ii) What are the adaptations shown by polar animals?
(iii) What are the chief characteristics of polar region animals?
(iv) What values are shown by Himani?
6.
Does light factor affect the distribution of organisms? Write a brief note giving suitable examples of either plants or animals.
7.
Comment on the following figures 1,2 and 3 : A,B,C,D,G,P,Q,R,S are species
8.
Give one example for each of the following:
(i) Eurythermal plant species_________.
(ii) A hot water spring organism _________.
(iii) An organism seen in deep ocean trenches _________.
(iv) An organism seen in composite pit_________.
(v) A parasitic angiosperm _________.
(vi) A stenothermal plant species _________.
(vii) Soil organism _________.
(viii) A benthic animal Soil organism _________.
(ix) Antifreeze compound seen in antarctic fish Soil organism_________.
(x) An organism which can conform Soil orga.niam_________.
9.
Comment on the growth curve given below.
1.
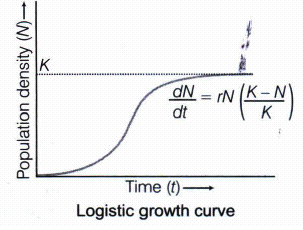
Initially, after a lag phase, the population will grow in an exponential manner as the nutrients and space will be abundant. When the food sources get depleted, the population density starts decreasing and ends in an asymptote phase, then the population density reaches the carrying capacity (maximum number of given environment can sustain indefinitely).
The population shows a pattern of logistic growth giving an S-shaped curve. where, K-carrying capacity, N=population density at time 't', r = Intrinsic rate of natural increase
2.
Figure A It is a 'pyramid' shaped age pyramid. In this figure, the base,i.e. pre-reproductive stage is very large as compared with the reproductive and post-productive stages of the population.
This type of age structure indicates that the population would increase rapidly.
Figure B It is an 'inverted bell' shaped pyramid. In this figure, the pre-reproductive and reproductive stages are same. This type of age structure indicates that the population is stable.
Figure C It is an urn-shaped pyramid. In the figure, the pre-reproductive and reproductive stages are less than the post-reproductive stages of this population. In this population more older people are present. This type of age structure indicates that the population definitely is declining.
3.
(i) Population attributes are certain characteristic of a population. Some of them are as follows:
(a) Population size or density is the number of individuals of a species per unit area or volume.
Population Density
\((PD)=\frac { Number\quad of\quad individuals\quad in\quad a\quad region\quad (N) }{ Size\quad of\quad unit\quad area\quad in\quad the\quad region\quad (S) } \)
\(\\ or, \quad PD\quad =\quad \frac { N }{ S } \)
(b) Birth rate or natality is expressed as the number of births per 1000 individuals of a population per year, e.g. if in a pond, there are 20 lotus plants last year and through reproduction 8 new plants are added
Birth rate = \(\frac { 8 }{ 20 } \) = 0.4 offspring per lotus per year
(c) Death rate or mortality is expressed as the number of deaths per 1000 individuals of a population per year, i.e. if 4 individuals in a population of 40 fruitflies died during a specified time interval (say a week).
Death rate =\(\frac { 4 }{ 40 } \)=0.1 individuals per fruitfly per week
(d) Sex ratio is expressed as the number of females and males per 1000 individuals of a population in a given time, e.g. 60% females and 40% males in population.
(e) Age pyramid When the age distribution (percent individuals of a given age or age group) is plotted for the population, this is called age pyramid.
(ii) Population density is the number of people living per unit of an area.
Three ways of measuring population density of a habitat.
(a) Biomass or percentage cover, e.g. hundred Parthenium plants and one huge banyan tree.
(b) By measuring relative density, e.g. the number of fish caught per trap from a lake.
(c) Indirect estimation, e.g. without seeing or actually counting population sizes, e.g. the tiger census is often based on pug marks and faecal pellets.
4.
(i) Predation (Tiger-predator and deer-prey)
(ii) The role of predators is
(a) To keep prey population under control
(b) To help in maintaining species diversity in a community by reducing the intensity of competition among prey species.
(iii) Population interaction seen in nature are:
(a) Predation
(b) Parasitism
(c) Commensalism
(d) Mutualism
(iv) Animals lover and sympathy towards animals
5.
(i)Smaller animals are rarely found in polar regions because such animals have surface area relative to their volume and they tend to loose heat very fast when it is cold outside. This is they are rarely found in polar regions
(ii) Animals that live in polar regions are adaptable to polar environments by features like the presence of thick skin coat, tendency to change colour or camouflage to white in snow and high metabolic rate. These features allow animals to adapt in colder environments.
(iii) Chief characteristics of polar region animals are:
(a) large sizes
(b) hairy skin
(c) lipid layer beneath the skin
(iv) Himani showed curiosity and eagerness for learning new things
6.
Plants require sunlight for photosynthesis. Therefore, light is an important factor that affects the distribution of plants, e.g.,
(i) Many species of small plants (herbs and shrubs) growing in forests are adapted to photosynthesis optimally under very low light conditions so they are seen distributed in shady areas under tall, canopied trees.
(ii) Many plants in the shade will grow vertically to gain access to light. These plants will appear to have maller4 leafs than others of the same species of the same age found in conditions with better sunlight.
(iii) Large sized trees will be present in areas that get abundant sunlight.
(iv) Plants dependent on sunlight to meet their photoperiodic requirements of flowering, will try to be distributed in area where this requirement is being met for their reproductive success.
7.
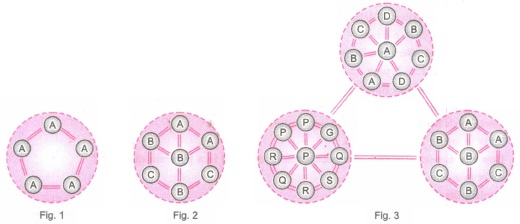
Fig 1. represents interaction between individuals of a single population.
Fig 2. represents interaction between individuals of 3species (A,B,C) in a community.
Fig 3. represents a biome having 3 communities at different stages of development
8.
(i) Artemesia
(ii) Thermus aquaticus
(iii) Euplectella
(iv) Earthworm
(v) Cuscuta
(vi) Coconut Paim
(vii) Earthworm
(viii) Agler Fish
(ix) Anti Freeze Protein
(x) Reptile- wall Lizard.
9.
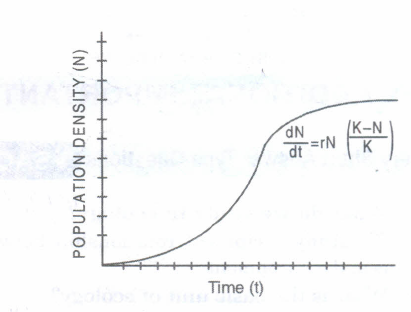
The growth curve shown aboveis logistic growth curve or S-shaped curve.
Logistic growth curve is considered more realistic because unlimited resources are not available in an ecosystem or in a habital, where
K-stands for carrying capacity.
N-indicates population density, which is the number of species of a population per unit area. r-is for intrinsic rate of natural increase.

12th Standard CBSE Syllabus & Materials
12th Standard CBSE
CBSE 12th Computer Science Python Revision Tour I - New Previous year Question Papers Study Material - QB365 Set A
NEW12th Standard CBSE
CBSE 12th Business Studies Planning Important Questions And Answers Study Material - QB365 Set A
NEW12th Standard CBSE
CBSE 12th Business Studies Business Environment Important Questions And Answers Study Material - QB365 Set A
NEW12th Standard CBSE
CBSE 12th Business Studies Principles of Management Important Questions And Answers Study Material - QB365 Set A



NCERT Books

Syllabus

Exam Pattern

Sample Question Papers

Previous year Question Papers

Important Notes

MCQ Practice test

NCERT Exemplers

Case study Questions

Image Based Questions

Passage based Questions

HOT Questions

Value Based Questions

Model Questions Papers
NCERT ( Book Back ) Questions

Assertion and Reason
Important Questions And Answers

CBSE 12th Standard CBSE Subjects
CBSE Standards









