
 100% FREE ACCESS
12th Standard CBSE Syllabus & Materials
12th Standard CBSE
CBSE 12th Economics Government Budget and the Economy Previous year Question Papers Study Material - QB365 Set A
NEW12th Standard CBSE
CBSE 12th Computer Science Interface Python with MySQL - New Previous year Question Papers Study Material - QB365 Set A
NEW12th Standard CBSE
CBSE 12th Computer Science Database Concept - New Previous year Question Papers Study Material - QB365 Set A
NEW12th Standard CBSE
CBSE 12th Computer Science Data Communication - New Previous year Question Papers Study Material - QB365 Set A
NEW12th Standard CBSE
CBSE 12th Computer Science Data Structures - New Previous year Question Papers Study Material - QB365 Set A
NEW12th Standard CBSE
CBSE 12th Computer Science Functions - New Previous year Question Papers Study Material - QB365 Set A

Published on: 31/07/2018
Some of the important questions are prepared from this Determination of Income and Employment. In this question paper, questions are prepared from the book back and creative question.
Students, subscribe and get plenty of question paper with answer key. For subscription please click here.
Download CBSE Class 12th Standard CBSE undefined question papers, sample papers, important questions, and previous year solved papers in PDF format. Get free study materials, NCERT solutions, and exam preparation resources for Class 12th Standard CBSE undefined
Questions + Answers key
Take MCQ Biology Test
1.
If MPC = 0, the value of multiplier is:
0
1
Between 0 and 1
Infinity
2.
Which out the following is a monetary measure to correct deficient demand?
Reduce Government Spending
Increase Government Spending
Lowering Margin Requirements
None
3.
APC is obtained by:
Y-S
\(\frac { C }{ Y } \)
\(\frac { \triangle C }{ \triangle Y } \)
\(\frac { Y-S }{ \triangle Y } \)
4.
If the investment multiplier is 1, what will be the value of Marginal Propensity to Consume?
2
4
1
0
5.
Investment is an addition to_______
supply
current stock
capital stock
None of these
6.
Given that National Income is Rs.80 crore and consumption expenditure is Rs. 64 crore, find out Average Propensity to save. When income rises to Rs.100 crore and consumption expenditure to Rs.78 crore, what will be the Average Propensity to consume and Marginal Propensity to Consume?
7.
Complete the following table:
| Income(Rs.) | Saving (Rs.) | Average Propensity to Consume (APC) | Marginal Propensity to Consume (MPC) |
| 0 | -40 | - | - |
| 50 | -20 | ... | ... |
| 100 | 0 | ... | 0.6 |
| 150 | 30 | 0.8 | ... |
| 200 | 50 | ... | ... |
8.
Real income increases in the situation of excess demand. Do you agree?
9.
Distinguish between inflationary gap and diflationary gap. State one measure for each, by which these can be corrected.
10.
What is meant by involuntary unemployment?
11.
What is meant by full employment ?
12.
If the value of investment multiplier is unity, what will be the value of MPC?
13.
Can the value of APS be negative? If yes, when.
14.
What is meant by ex-ante investment?
15.
In an economy income increase from Rs.5,000 to Rs.6,000 crore as a result of 20% increase in investment. calculate the value of k.
16.
Complete the following table:
| Income | Average Propensity to Consume | Marginal Propensity to Save | Consumption Expenditure |
| 1,000 | 0.50 | 500 | |
| 2,00 | 0.55 | - | - |
| 2.500 | 0.60 | - | - |
17.
Complete the following table:
| Income | Savings | Marginal Propensity to Save | Average Propensity to Save |
| 0 | 40 | ||
| 50 | 70 | ................. | ................... |
| 100 | 100 | ................. | ................... |
| 150 | 120 | ................ | ................... |
18.
Explain the consumption function with the help of schedule and diagram.
19.
Explain with the help of saving and investment curves, the equilibrium level of income in an economy. Is equality between saving and investment necessary for full employment?
1.
(b)
1
2.
(c)
Lowering Margin Requirements
3.
(b)
\(\frac { C }{ Y } \)
4.
(d)
0
5.
capital stock
6.
Here, in first condition, Y=Rs. 80 crore
C=Rs. 64 crore
Hence, S=Y-C=80-64=Rs. 16 crore
Now, Average Propensity to Save,
\(APS=\frac { S }{ Y } \) = \(\frac { 16 }{ 80 } \)=0.20
Again, when income and consumption expenditure rise,
Y=Rs.100 crore, C=Rs.78 crore,
So, Average Propensity to Consume,
\(APC=\frac { C }{ Y } \)= \(\frac { 78 }{ 100 } \)=0.78
Here, \(\Delta Y\)=100-80=Rs.20 crore
and \(\Delta C\)=78-64=Rs.14 crore
So, Marginal Propensity to Consume,
\(MPC=\frac { \Delta C }{ \Delta Y } \)=\(\frac { 14 }{ 20 } \)=0.70
7.
C=Y-S, APC=C/Y, \(MPC=\frac { \Delta C }{ \Delta Y } \)
| Income (Y) (Rs.) | Saving (S) (Rs.) | Consumption (C) (Rs.) | APC(C/Y) | \(\Delta C\) | \(\Delta Y\) | \(MPC=\frac { \Delta C }{ \Delta Y } \) |
| 0 | -40 | 40 | - | - | - | - |
| 50 | -20 | 70 | 1.4 | 30 | 50 | 0.6 |
| 100 | 0 | 100 | 1 | 30 | 50 | 0.6 |
| 150 | 30 | 120 | 0.8 | 20 | 50 | 0.4 |
| 200 | 50 | 150 | 0.75 | 30 | 50 | 0.6 |
8.
()
No, real income cannot increase, there will be rise in monetary income only.
9.
The excess of Aggregate Demand above the level required to maintain equilibrium in full employment situation in an economy is termed as inflationary gap. It causes inflation and increases price levels in an economy. When there is involuntary unemployment in the economy, there is a short fall in Aggregate Demand from the level required to maintain a full employment equilibrium. This short fall is termed as deflationary gap. It causes reduction in prices in the economy. Inflationary and deflationary gap can be corrected by opting following means:
(i) To correct the inflationary gap, government should form fiscal and monetary policy to close the gap. Monetary policy can be used in such a manner that it will contract the money supply in the economy by raising interest rates and opts the method of progressing taxation.
(ii) To correct the deflationary gap, government should stood doing the additional expenditure equal to deflationary gap, so that deflationary gap is wiped out.
10.
()
Involuntary unemployment refers to a situation in which people are ready to work at the current wage rate but do not find work.
11.
()
Full employment refers to a situation where there is no involuntary unemployment, i.e., those who are willing to work at. the current wage rate get work.
12.
()
Zero
13.
()
Yes, the value of APS can be negative, at very low level of income when consumption expenditure exceeds income, e.g., at an income level of Rs. 200, when the consumption expenditure is Rs.240, the saving is (-) 40.
So, APS = \(\frac { S }{ Y } \) = \(\frac { -40 }{ 200 } \) = - 0.2
14.
()
Investment intended to be made during the year is "Ex-ante Investment".
15.
\(\triangle \)Y = Rs.1,000 crores, \(\triangle \)I = 20%
\(\therefore\) \(\triangle \)Y = \(\frac { 1000 }{5000 } \) \(\times\)100 = 20%
k = \(\frac { \triangle Y }{ \triangle I } \) = \(\frac { 20 }{20 } \) = 1
16.
| Income (Y) | APS = \(\frac { S }{ Y } \) | Savings APS\(\times\)Y | MPC=\(\frac { \triangle C }{ \triangle Y } \) | MPS | Consumption Expenditure (Y-S) |
| 1,000 | 0.50 | 500 | - | - | 500 |
| 2,000 | 0.55 | 1,100 | \(\frac { 400 }{ 1000 } =0.4\) | 0.6 | 900 |
| 2,500 | 0.60 | 1,500 | \(\frac { 100 }{ 500 }=0.2 \) | 0.8 | 1000 |
17.
| Income (Y) | Consumption (C) | Savings (Y-C) | MPS = \(\frac { \triangle S }{ \triangle Y } \) | APS =\(\frac { S }{ Y } \) |
| 0 | 40 | -40 | - | \(\frac { -40 }{ 0 } = \infty \) |
| 50 | 70 | -20 | \(\frac { +20 }{ 50 } = +0.4 \) | \(\frac { -20 }{ 50 } = -0.4 \) |
| 100 | 100 | 0 | \(\frac { 20 }{ 50 } = 0.4 \) | \(\frac { 0 }{ 100 } = 0\) |
| 150 | 120 | 30 | \(\frac { 30 }{ 50 } = 0.6\) | \(\frac { 30 }{ 150 } = 0.2\) |
18.
Consumption function shows the relationship between consumption and income.
C = f (Y)
This equation states that there is a direct relation between consumption and the level of income. As the level of income increases, consumption also increases but the increase in consumption is less than the increase in income. The concept of consumption function can be further explained by following consumption schedule and curve:
| Income | Consumption (Rs. crores) |
| 0 | 50 |
| 100 | 100 |
| 200 | 150 |
| 300 | 200 |
| 400 | 250 |
| 500 | 300 |
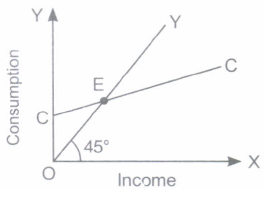
The above table and diagram show that as the income increases, consumption
also increases but the increase in consumption is less than increase in income.
19.
The equilibrium level of income is determined at a point where saving and investment are equal, i.e., S = 1.The given table and diagram illustrate the idea:
| Income (Y) | Consumption (C) | Saving (S) = Y-C | Investment (Rs.crores) (I) |
| 0 | 50 | -50 | 100 |
| 100 | 100 | 0 | 100 |
| 200 | 150 | 50 | 100 |
| 300 | 200 | 100 | 100 |
| 400 | 250 | 150 | 100 |
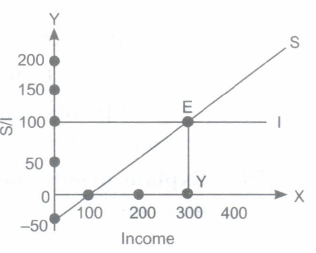
The given table and diagram show that the equilibrium level of income is ~ 300 crores and at this point S (l00) = I (l00).
The equilibrium level of income may not necessarily be at the full employment level, i.e., it is not necessary that there will always be full employment at the equilibrium level of income.

12th Standard CBSE Syllabus & Materials
12th Standard CBSE
CBSE 12th Computer Science Python Revision Tour I - New Previous year Question Papers Study Material - QB365 Set A
NEW12th Standard CBSE
CBSE 12th Business Studies Planning Important Questions And Answers Study Material - QB365 Set A
NEW12th Standard CBSE
CBSE 12th Business Studies Business Environment Important Questions And Answers Study Material - QB365 Set A
NEW12th Standard CBSE
CBSE 12th Business Studies Principles of Management Important Questions And Answers Study Material - QB365 Set A



CBSE 12th Standard CBSE Subjects
CBSE Standards











