
 100% FREE ACCESS
11th Standard Syllabus & Materials
11th Standard
TN 11th Tamil இயற்கை வேளாண்மை,சுற்றுச்சூழல் -செய்யுள் - மனோன்மணீயம் Important Questions And Answers Study Material - QB365 Set A
NEW11th Standard
TN 11th Tamil என்னுயிர் என்பேன் -துணைப்பாடம் - இசைத்தமிழர் இருவர் Important Questions And Answers Study Material - QB365 Set A
NEW11th Standard
TN 11th Tamil மொழி கலை -செய்யுள் - ஒவ்வொரு புல்லையும் Important Questions And Answers Study Material - QB365 Set A
NEW11th Standard
TN 11th Tamil பீடு பெற நில் - இலக்கணம் - பகுபத உறுப்புகள் Important Questions And Answers Study Material - QB365 Set A
NEW11th Standard
TN 11th Tamil பீடு பெற நில் - துணைப்பாடம் - வாடிவாசல் Important Questions And Answers Study Material - QB365 Set A
NEW11th Standard
TN 11th Tamil பீடு பெற நில் - செய்யுள் - குறுந்தொகை Important Questions And Answers Study Material - QB365 Set A

Published on: 12/03/2019
11th Public Exam March 2019 Important 5 Marks Questions
Download Tamil Nadu 11th Standard Economics question papers, model tests, one-mark questions, important questions, and public exam papers in PDF format. Free study materials and answer keys for TN State Board students.
Questions + Answers key
Take MCQ Economics Test
1.
Explain B. R. Ambedkar's contribution to Indian economy.
2.
What are the uses of the integration in Economics?
3.
A manufacturer estimates that, when units of a commodity are produced each month the total costs will be TC(Q) = 128 + 60Q + 8Q2. Find the marginal cost, average cost, fixed cost, variable cost, average fixed cost and average variable cost.
4.
Explain the theory of Consumer's surplus with the help of a table and a diagram.
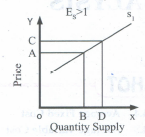
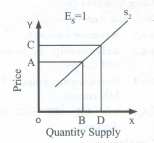
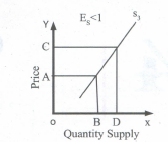
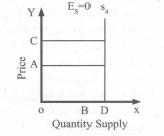
5.
Trace the development of Banking system in Tamil Nadu.
6.
Explain the Modern Theory of Rent.
7.
Explain the equilibrium conditions for a firm with the help of diagrams.
8.
Define Total Revenue and Explain its behaviour when the price is constant and when the price is declining.
9.
State the assumption on which the explanation and analysis of production possibility curve based upon.
10.
Explain the wealth definition given by Adam Smith.
11.
Explain briefly Levels or degrees of Price Elasticity of Demand?
12.
Explain briefly the Iso-cost Line with the help of a diagram?
13.
What are the problem in Agree?
14.
What are the major changes after 1991?
15.
What are this Achievement of Green Revolution?
16.
What are classification of Market?
17.
What is Indifference curve map? Explain the properties of indifference curve with diagrams.
18.
Explain the four sources depend upon the supply of loanable funds.
19.
The demand and supply functions are Pd= 1600 - x2 and Ps = 2x2 + 400 respectively. Find the consumer's surplus and producer's Surplus at equilibrium point.
20.
Explain weakness features of Indian Economy.
21.
If the total cost = 100 + Q3, find out AVC, AC, TFC, AFC and TVC when Q = 10.
22.
Explain the stable equilibrium with the help of diagram.
23.
24.
Explain the role of SSIs in economic development ?
25.
26.
Explain the Marginal Productivity Theory of Distribution.
27.
Explain the types of elasticity supply with the help of diagram.
28.
29.
List out the properties of iso-quants with the help of diagrams.
30.
31.
Explain the objectives and characteristics of SEZs.
32.
Explain basic problems of the economy with the help of production possibility curve.
33.
Compare and contrast various definitions of Economics.
34.
35.
How price and output are determined under the perfect competition?
36.
Discuss the short run cost curves with suitable diagram.
37.
If total cost = 10+ Q3, find out AC, AVC, TFC, AFC when Q = 5.
38.
Bring out Jawaharlal Nehru's contribution to the idea of economic development.
39.
Explain the strong features of Indian economy.
1.
B. R. Ambedkar (1891-1956) was a versatile personality. He was the architect of the Indian constitution, a custodian of social justice and a champion of socialism and state planning. Ambedkar's writings included. 'Ancient Indian Commerce' (a thesis submitted to the Columbia University for the award of the Mater of Arts Degree in 1915), 'National Dividend of India:' A Historical and Analytical Study (a thesis for which he was awarded Ph.D). His thesis was published as "The Evolution of Provincial Finance in British India: A Study of the Provincial Decentralization of Imperial Finance". Ambedkar's thesis on "Provincial Decentralization of Imperial Finance in British India" was accepted for the MSc, degree in 1921. And his theis 'The Problem of the Rupee' was accepted for the award of the D.Sc degree by the London School of Economics in 1923. It is a miracle that RBI was conceptualized as per the guidelines presented by Ambedkar in his book, "The Problem" of the Rupee; Its origin and its solution". The main economic ideas of Ambedkar may be studied under four broad headings:
(i) Financial Economics: Much of the work done by Ambedkar during his stay abroad mostly during the period 1913-1923, was in the field of Finance Economics. Ambedkar divided the evolution of provisional finance into three stages:
(a) Budget by Assignment (1871-72 to 1876-77);
(b) Budget by Assigned Revenue (1877-78 to 1881-82); and
(c) Budget by Shared Revenues (1882-83 to 1920-1921).
(ii) Agricultural Economics: In 1918, Ambedkar published a paper "Small Holding in India and their Remedies". Citing Adam Smith's "Wealth of Nations", he made a fine distinction between "Consolidation of Holdings" and "Enlargement of Holdings".
(iii) Economics of Caste: Ambedkar believed that caste was an obstacle to social mobility. It resulted in social stratification. He was of the firm view that individuals must be free to change their occupations. Moreover, the caste system caused social tensions. The caste system has resulted in the absence of social democracy in India as distinct from political democracy.
(iv) Economics of Socialism: Ambedkar was a socialist. He was a champion of state socialism. He advocated the nationalisation of all key industries and suggested state ownership of land and collective fanning. He was for state monopoly of insurance business. 'Not only that, he advocated compulsory insurance for every citizen. There is no doubt that Ambedkar was a great economist. But his academic work as an economist was eclipsed by his greater contributions in the field of law and politics. Above all he was a great social reformer.
2.
Differential calculus measures the rate of change of functions. In Economics it is also necessary to reverse the process of differentiation and find the function F(x) whose rate of change has been given. This is called integration. The function F(x) is termed an integral or anti-derivative of the function f(x). The integral of a function f(x) is expressed mathematically as \(\int { f\left( x \right) dx=F\left( x \right) +C } \)
Here the left hand side of the equation is read "the integral of f(x) with respect to x", The symbol J is an integral sign, f(x) is integrand, C is the constant of integration, and F(x) + c is an indefinite integral. It is so called because, as a function of X, which is here unspecified, it can assume many values.
3.
Given that TC(Q) = 128 + 60Q + 8Q2
We know TC = Fixed cost + variable cost
MC (Q) =\(\frac { d(TC) }{ dQ } \)
= 0 + 60(1)Q1-1 + 8(2)Q2-1
= 0 + 60Q0 + 16Q1(Since, Q0= 1)
MC = 60 + 16Q
Average Cost =\(\frac { TC }{ dQ } \)
=\(\frac { 128+60Q+8Q^{ 2 } }{ Q } \)
AC = \(\frac { 128 }{ Q } \) + 60 + 8Q
Constant value is known as fixed cost
Fixed cost = 128
FC = 128
Average Fixed cost = \(\frac { 128 }{ Q } \)
AFC = \(\frac { 128 }{ Q } \)
Average Variable cost = 60 + 8Q (total variable cost divided by Q)
∴ AVC = 60 + 8Q
4.
Definition: Alfred Marshall defines consumer's surplus as, "the excess of price which a person would be willing to pay a thing rather than go without the thing, over that which he actually does pay is the economic measure of this surplus satisfaction. This may be called consumer's surplus".
Assumption:
(1) Marshall assunied that utility can be measured.
(2) The marginal utilities of money of the consumer remain constant.
(3) There are no substitutes for the commodity in question.
(4) The taste, income and character of the consumer do not change.
(5) Utility of one commodity does not depend upon the other commodities.
Explanation: The concept of consumer's surplus can be explained with the help of an example. Suppose a consumer wants to buy an apple.
He is willing to pay rs.4, rather than go without it and the actual price of the apple is rs.2. Hence the consumer's surplus is rs.2 (rs.4 - rs.2).
Thus, consumer's surplus is the difference between the price that a consumer is willing to pay (potential price) and what he actually pays. Therefore,
Consumer's surplus = What a person is willing to pay - What he actually pays.
OR
Consumer's surplus = Potential price - Actual price.
Mathematically, Consumer's surplus = TU - (P x Q)
where, TU = Total Utility, P = Price and Q = Quantity of the commodity
Assumption:
(1) Marshall assunied that utility can be measured.
(2) The marginal utilities of money of the consumer remain constant.
(3) There are no substitutes for the commodity in question.
(4) The taste, income and character of the consumer do not change.
(5) Utility of one commodity does not depend upon the other commodities.
Explanation:
The concept of consumer's surplus can be explained with the help of an example. Suppose a consumer wants to buy an apple. He is willing to pay Rs 4, rather than go without it and the actual price of the apple is Rs2. Hence the consumer's surplus is Rs2 Rs4 - Rs 2). Thus, consumer's surplus is the difference between the price that a consumer is willing to pay (potential price) and what he actually pays. Therefore,
Consumer's surplus = What a person is willing to pay - What he actually pays.
OR
Consumer's surplus = Potential price - Actual price.
Mathematically,
Consumer's surplus = TU - (P x Q)
where, TU = Total Utility, P = Price and Q = Quantity of the commodity
Consumer's Surplus
| Units of commodity(Apple) | Willingness to pay or potential price(Marginal Utility) | Actual Price | Consumer's Surplus Potential Price Actual Price |
| 1 2 3 4 5 |
6 5 4 3 2 |
2 |
6-2=4 5-2=3 4-2=2 3-2=1 2-2=0 |
| Total | 20 | 10 | 10 |
Where,
TU= Total Utility, P = Price and Q = Quantity of the commodity
The measurement of consumer's surplus is illustrated in the Table.
In the Table the consumer is willing to pay rupees 6, 5, 4, 3 and 2 for purchasing the successive units of apples.
Hence, he is willing to pay (potential Price Total Utility) ~20 for apples. But, he actually pays ~lQ ~2 x 5» for getting 5 apples. Hence,
Consumer's Surplus = Total Utility (Actual Price x units of Commodity)
= TU - (P x Q)
= 20 - (2 x 5)
= 20 - 10 = 10.
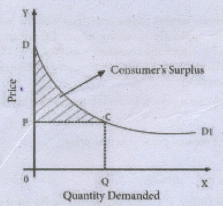
In the diagram, X axis shows the amount demanded and Y axis represents the price.\({ DD }_{ 1 }\) shows the utility which the consumer derives from the purchase of different amounts of commodity.
When price is OP, the amount demanded is OQ. Hence, actual price is OPCQ (OP x OQ). Potential Price (Total Utility) is ODCQ.
Therefore,
Consumer'Surplus = ODCQ - OPCQ
= PDC (the shaded area)
Criticism
(1) Utility cannot be measured, because utility is subjective.
(2) Marginal utility of money does not remain constant.
(3) Potential price is internal, it might be known to the consumer himself.
5.
Banking in Tamil Nadu:
(i) In Tamil Nadu, Nationalised banks account for 52% with 5,337 branches, Private Commercial Banks 30% (3,060) branches.
(ii) State Bank of India and its associates 13% (1,364), Regional Rural Banks 5% (537) branches and the remaining 22 foreign bank branches.
(iii) Total deposits of the banks in Tamil Nadu registered a year-on-year increase of 14.32% by March 2017 and touched Rs.6,65,068.59 crores. Total credit of the banks in Tamil Nadu registered a year-on-year increase of 13.50% by March 2017 and touched 6,95,500.31 crores.
(iv) The share of Priority Sector Advances stands at 45.54% as against the national average of 40%. The percentage of Agricultural advances to total advances as at the end of March 2017 works out to 19.81% as against the national average of 18%.
(v) Banks in Tamil Nadu have 'maintained one of the highest Credit Deposit Ratio of 119.15% in the country whereas this ratio is 77.5% at the national level.
6.
The Modern Theory of Rent 1 Demand & Supply Theory of Rent:
The classical economists thought that land as a factor of production was different from other factors of production. But modern economists thought that all the factors of production are alike and there is no basic difference between them. Hence, a special theory of rent, developed by Ricardo is not necessary. Therefore, economists like Joan Robinson and Boulding have contributed their, ideas for the determination of rent, which is known as the "Modern Theory of Rent".
"The essence of the conception of rent is the conception of surplus earned by a particular part of a factor of production over and above the minimum earnings that is necessary to induce it to do work" - Joan Robinson Rent is the difference between the actual earnings of a factor of production and its transfer earning.
Rent = Actual earning - Transfer earning.
The minimum payment that has to be made to a particular factor of production to retain it in its present use is known as transfer earnings.
7.
Equilibrium Conditions for a Firm:
Equilibrium of the firm means that the firm reaches the maximum profit. Now, there are two approaches (TC = TR) for calculating the maximum profits
(i) Total curve approach:
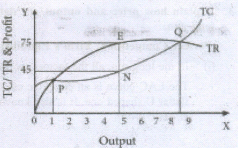
(a) In the TC-TR Approach, profit is obtained by a firm, through the difference between the TC and the TR., Equilibrium is obtained at the point where maximum difference between the TC and TR occurs.
(b) This TC- TR method is not generally adopted in the calculation of maximum profit. Hence to calculate profit/loss, economists resort to the MC = MR approach. Shaded area denotes profit. Profit is maximum when Q = 5
(ii) Marginal curve: Approach in this approach, the following two conditions are to be verified to obtain equilibrium of a firm.
(a) MC = MR
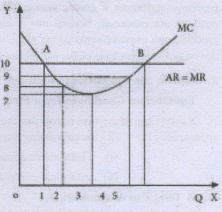
Look at the following hypothetical situation. A rational seller will not be in equilibrium at output level, though MC = MR at that point, since continuing production, his profit. increases. When he produces an output beyond 1 unit till he reaches 5 units, his MC < MR. It is advantageous for the producer to continue his production. Again, he will not be in equilibrium beyond 5 units of Q, when his MC > MR, implying that the seller incurs loss.
Therefore, he is said to be in equilibrium, i.e., at the point of maximum profit when his MC is equal to MR. Hence, MC = MR is the first condition for the equilibrium. (Note: This is a necessary condition but not a sufficient condition).
(b) MC cuts MR curve from below y_ (Sufficient conditions) A firm under perfect competition faces a horizontal price line. (It is also the AR curve and the MR curve). A firm under 10 imperfect competition focuses declining: price line. The MC is V-shaped and it 1 cuts MR at two points, both from above (i.e., at point A) and also from below (i.e., at point B) Only at point B, the equilibrium condition is fulfilled. Thus for equilibrium under all market situations the two conditions viz., MC = MR; and MC cuts MR from below.
8.
Total Revenue:
Total revenue is the amount of income received by the firm from the sale of its products. It is obtained by multiplying the price of the commodity by the number of units sold.
TR = p x Q
where, TR denotes Total Revenue, P denotes Price and
Q denotes Quantity sold.
For example, a cell-phone company sold 100 cell-phones at the price of t500 each. TR is
Rs.50,000. (TR= 500 x 100 = 50,000).
Total Revenue - Constant Price
| Quantity sold (Q) |
Price (P) |
Total Revenue (TR) |
|
1 |
5 |
5 10 15 20 2 30 |
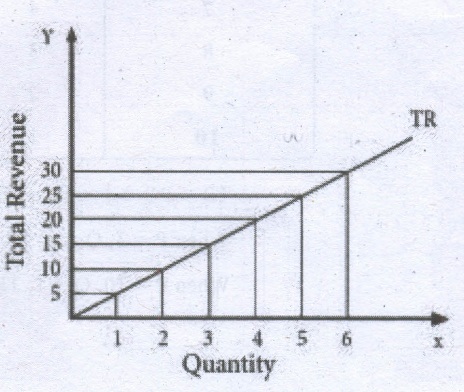
When price is constant, the behaviour of TR is shown in the table and the diagram, assuming P = 5. When P = 5; TR = PQ
When price is declining with increase in quantity sold. (Eg. Imperfect Competition on the goods market) the behaviour of TR is shown in the table and in the diagram. TR can be obtained from Demand function: If Q = 11-P, When P = 1, Q = 10
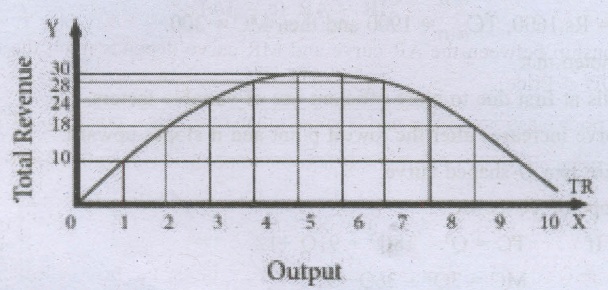
Total Revenue - Price declining
| Quantity sold (Q) | Price (P) | Total Revenue (TR) |
|
1 |
10 |
10 |
TR = PQ = 1 x 10 = 10
When P = 3, Q = 8, TR = 24
When P = 10, Q = 1, TR = 10
9.
The explanation and analysis of production possibility curve is based upon certain assumptions, some of them are following.
(i) The time period does not change. It remains the same throughout the curve.
(ii) Techniques of production are fixed.
(iii) There is full employment in the economy.
(iv) Only two goods can be produced from the given resources.
(v) Resources of production are fully mobile.
(vi) The factors of production are given in quantity and quality.
(vii) The law of diminishing returns operates in production. Every production possibility curve is based upon these. assumptions. If some of these assumptions changes or neglected, then it affects the nature of production possibility curve.
10.
Wealth Definition: Adam Smith
(i) Adam Smith (1723 - 1790), in his book "An Inquiry into Nature and Causes of Wealth of Nations" (1776) defines "Economics c the science of wealth".
(ii) He explains how a nation's wealth is created and increased. He considers that the individual in the society wants to promote his own gain and in this process, he is guided and led by an "invisible hand".
(iii) He states that every man is motivated by his self interest This means that each person works for his own good.
(iv) Smith favours the introduction of "division of labour" to increase the quantum of output.
(v) Severe competition in factories and society helps in bettering the product.
(vi) Supply force is very active and a commodity is made available to the consumers at the lowest price.
Criticism:
(vii) For Smith, Economics consists of 'wealth-getting' activities and 'wealth-spending' activities.
(viii) An undue emphasis is given to material wealth. Wealth is treated to be an end in itself.
(ix) This view leads him to ignore human welfare as an essential part of Economics. Smith gives his definition when religious and spiritual values are held high.
(x) Ruskin and Carlyle regard Economics as a 'dismal science', "pig science" etc. as it teaches selfishness which is against ethics.
11.
Definition: The Price Elasticity of Demand is commonly known as the elasticity of demand which refers to the degree of responsiveness of demand to the change in the price of the commodity.
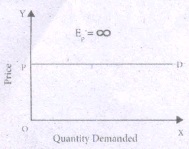
i. Perfectly Elastic Demand (Ep = \(\infty \)):
The demand is said to be perfectly elastic when a slight change in the price of a commodity causes an infinite. change in its quantity demanded. Such as, even a small rise in the price of a commodity can result in greater fall in demand even to zero. In some cases a little fall in the price can result in the increase in demand to infinity. In perfectly elastic demand the demand curve is a horizontal straight line parallel to x axis.
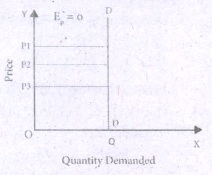
ii. Perfectly Inelastic Demand (Ep = 0)
When there is no change in the product due to the change in the price, then the demand is said to be perfectly inelastic. Here, the demand curve is a vertical straight line which shows that the demand remains unchanged irrespective of change in the price., i.e. quantity OQ remains unchanged at different prices, P1P 2, and P3.
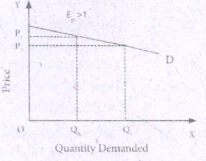
iii. Relatively Elastic Demand: (Ep > 1)
The demand is relatively elastic when the proportionate change in the demand for a commodity is greater than the proportionate change in Its price. Here, the demand curve is gradually sloping which shows that a proportionate change in quantity from 5 to 10 is greater than the proportionate change in the price from 11 to 10. Change in demand is: 10-5/5 x 100 = 100%
Change in price =10%. Hence, it is more elastic demand.
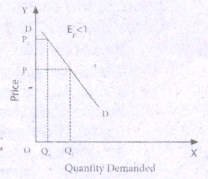
Relatively Inelastic Demand: (Ep < 1)
When the proportionate change in the demand for a product is less than the proportionate change in the price, the demand is said to be relatively inelastic. It is also called as the elasticity less than unity. Here the demand curve is steeply sloping, which shows that the change in the quantity from OQ0 to OQ1 is relatively smaller than the change in the price from OP1 to OP2.
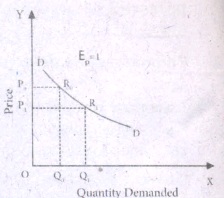
v. Unitary Elastic Demand (Ep = 1):
The demand is unitary elastic when the proportionate change in the price of a product results in the same propionate change in the quantity demand here the shape of the demand curve is a rectangular hyperbola, which shows that area under the curve is equal to one. Here OP0R 0Q 0= OP 1R 1Q 1.
12.
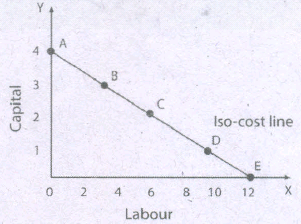
The Iso-cost line: The iso-cost line is an important component in analysing producer's behaviour. The iso-cost line represents different combinations of inputs which shows the same amount of cost. The iso-cost line gives information on factor prices and financial resources of the firm. It is otherwise called as "lso-price line" or "iso-income line" or "iso-expenditure line" or "total outlay curve".
Suppose that a producer has a total budget of H2O and for producing a certain level of output, he has to spend this amount on two factors Labour (L) and Capital (K). Prices of factors K is no and L is HO. Iso Cost Curve can be drawn by using the following hypothetical table.
| The Iso-Cost | |||
| Combination | Units of Capital Price = Rs 30 | Units of Labour Price = Rs 10 | Total Expenditure( in Rupees) |
| A | 4 | 0 | 120 |
| B | 3 | 3 | 120 |
| C | 2 | 6 | 120 |
| D | 1 | 9 | 120 |
| E | 0 | 12 | 120 |
As shown in Table, there are five combinations of capital and labour such as combination A represents 4 units of capital and zero units of labour and this combination costs Rs 120.
Similarly other combinations (B, C, D and E) cost same amount of rupees (Rs 120).
Symbolically,
4K + OL = Rs.120
3K + 3 = Rs.120
2K + 6L = Rs.120
lK + 9L = Rs.120, and
OK + 12L = Rs.120.
Thus, all the combinations A, B, C, D and E cost the same total expenditure.
From the figure it is shown that the costs to be incurred on capital and labour are represented by the triangle OAE. The line AE is called as Iso-cost line.
13.
i. People Related Problems
The problems related to individuals and their standard of living consist of illiteracy, lack of technical know how, low level of confidence, dependence on
ii. Infrastructural Related Problems:
Poor infrastructure facilities like, water, electricity, transport, educational institutions, communication, health, employment, storage facility, banking and insurance are found in rural areas.
iii. Economics related Problems:
The economic problems related to rural areas are: inability to adopt high cost technology, high cost of inputs, under privileged rural industries, low income, indebtedness and existence of inequality in land holdings and assets. In fertile areas, a few absentee landlords own large area and they do not evince greater Interest in improving the performance of agriculture.
iv. Leadership Related Problems:
The specific leadership related problems found in rural areas are: Leadership among the hands of inactive and incompetent people, self-interest of leaders, biased political will, less bargaining power and negation skills and dominance of political leaders.
v. Administrative Problems:
The rural administrative problems consist of political interference, lack of motivation and interest, low wages in villages, improper utilization of budget, and absence of monitoring and implementation of rural development programme.
14.
(i) Foreign exchange reserves started rising.
(ii) There was a rapid industrialization.
(iii) The pattern of consumption started improving (or deteriorating).
(iv) Infrastructure facilities such as express highways, metro rails, flyovers and airports started expanding (but the local people were thrown away).
15.
(i) The major achievement of the new strategy was to boost the production of major cereals viz., wheat and rice.
(ii) The green revolution was confined only to High Yielding Varieties (HYV) cereals, mainly rice, whar maize and jowar.
(iii) This Strategy was mainly directed to increase the production of commercial crops or cash crops such as sugarcane, cotton, Jute, Oilseeds and potatoes.
(iv) Per hectare productivity of all crops Had increased due to better seeds.
(v) Due to Multiple cropping and more use of chemical fertilizers the demand for labour increased.
16.
On the basis of Area:
(i) Local Market
(ii) Provincial Market
(iii) National Market
(iv) International Market
On the basis of Time:
(i) Market period
(ii) Short period Market
(iii) Long period Market
On the Basis Quantity of the Commodity:
(i) Whole-sale market
(ii) Retail Market
On the Basis of Competition:
(i) Perfect Competition Market
(ii) Imperfect Competition Market.
17.
a. Indifference Map:
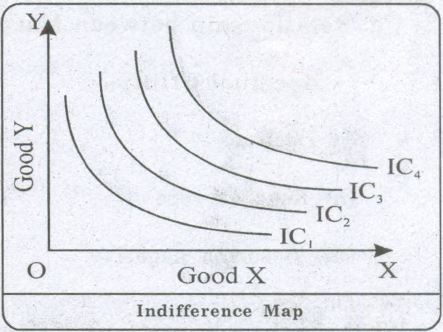
Indifference Map is a group of indifference curves for two commodities showing different levels of satisfaction. In this indifference map, it should be clearly understood that a higher indifference curve denotes higher level of satisfaction and a lower indifference curve represents lower level of satisfaction. Being rational, the consumer will always choose a higher indifference curve to get maximum satisfaction, other things being equal.
b. Properties of an Indifference curve:
i. Indifference curves slope downwards to the right
ii. Indifference curves are convex to the origin
iii. No two indifference curves can ever cut each other.
i. All indifference curves slope downwards from left to right:
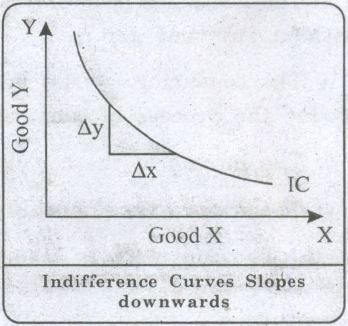
The downward slope of indifference curve must be attributed to the fact that the consumer in substituting good X by good Y, increases the amount of Y and reduces the amount of X. If the indifference curve were horizontal line running parallel to X axis then the combination which it represents is the same amount of Y but more and more of X. In that case, the satisfaction from the combination will not be equal. For the same reason, it can be said that indifference Curves will not be vertical.
ii. All indifference curves are convex to the origin:
This is because of the operation of a principle known as 'Diminishing Marginal Rate of Substitution'. The indifference curves are based on this principle. If they are concave to the origin, then it will mean that MRS is increasing. Indifference curve cannot be straight line except when the goods are perfect substitutes.
Marginal rate of substitution between X and Y refers to the amount of commodity Y to be offered in exchange for one unit of X commodity. The MRS goes on diminishing as consumer goes on substituting X for Y.
iii. No two indifference curves intersect each other:
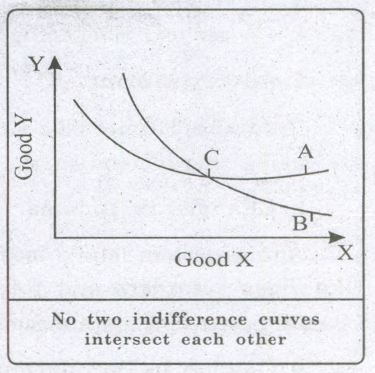
The third assumption is that no two indifference curves can ever cut each other. But in the Figure we find two indifference curves do cut each other. Point A which is on indifference curve 2 represents a higher level of satisfaction to the consumer than at point B which is on indifference curve 1. But point C lies on both curves. That means, two levels of satisfaction A and B which are unequal have become equal. That cannot be accepted. So indifference curves can never cut each other. These are the three assumptions about the shape of an indifference curve.
18.
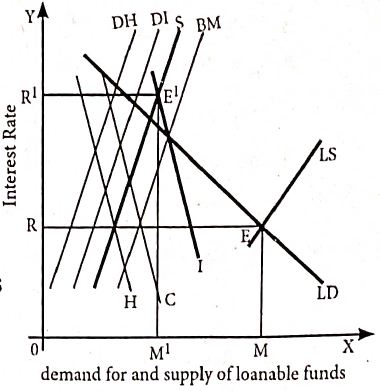
The supply of loanable funds depends upon the following four sources.
(i) Savings (S)
(ii) Bank Credit (BC)
(iii) Dishoarding (DH)
(iv) Disinvestment (DI)
(i) Savings (S):
1. Supply of loanable funds comes from savings
2. Savings may be of two types.
They are
(i) "ex-ante savings" and
(ii) "ex-post savings".
(ii) Bank Credit (BC):
1. Commercial banks create credit and supply of loanable funds to the investors.
(iii) Dishoarding (DH):
1. Dishoarding means bringing out the hoarded money into use.
2. It constitutes a source of supply of loanable funds.
(iv) Disinvestment (DI):
1. Disinvestment is the opposite of investment.
2. Not providing sufficient funds for depreciation of equipment.
3. All the four sources of supply of loanable funds vary directly with the interest rate.
19.
For equilibrium Pd = Ps
\(1600-x^{2} =2 x^{2}+400
\)
\(1600-400 =2 x^{2}+x^{2}
\)
\(3 x^{2} =1200
\)
\(x^{2} =400
\)
\(x =\pm 20
\)
\(P_{\mathrm{d}} =1600-(20)^{2} \)
=1600-400
=1200
\(\mathrm{P}_{\mathrm{s}} =2(20)^{2}+400 \)
= 2(400) + 400
= 800 + 400
= 1200
Consumer's surplus:
\(\mathrm{C}_{\mathrm{s}}=\int_{0}^{20}\left(1600-x^{2}\right) \mathrm{d} x-(20 \times 1200)
\)
\(=\left[1600 x-\frac{x^{3}}{3}\right]_{0}^{20}-(24000)=\left[1600(20)-\frac{20^{3}}{3}\right]-24000
\)
\(=32000-\frac{8000}{3}-24000=5,333.34\)
Producer's surplus:
\(\mathrm{P}_{\mathrm{s}} =(20 \times 1200)-\int_{0}^{20}\left(2 x^{2} +400\right) \mathrm{d} x
\)
\(=24000-\left[\frac{2 x^{3}}{3}+400 x\right]_{0}^{20}
\)
\(=24000-\left[\frac{2(20)^{3}}{3}+400(20)\right]=24000-\left[\frac{2 \times 8000}{3}+8000\right]\)
= 24000-5333.33 - 8000 = 10,666.67
20.
(a) Large Population:
(i) India stands the second largest population in the world.
(ii) Population growth rate of India is very high.
(iii) The growth rate in India is as high as 1.7 per 1000.
(iv) The annual addition of population equals the total population of Australia.
(b) Inequality and Poverty:
(i) The proportion of income and assets owned by top 10% of Indian goes on increasing.
(ii) This has led to an increase in the poverty level in the society and still a higher percentage of individuals are living below poverty line.
(c) Increasing prices of essential goods:
(i) The constant growth in the GDP and growth opportunities in the Indian economy, there have been steady increase in the prices of essential goods.
(ii) The continuous rise in prices erodes the purchasing power.
(d) Weak of Infrastructure:
There is still scarcity of the basic infrastructure like power, transport storage etc.
(e) Inadequate employment generation:
(i) The growth in production is not accompanied by creation of job.
(ii) The Indian economy is characterised by 'jobless growth'.
21.
TC = TFC + TVC
\(AVC=\frac{TVC}{Q}\)
\(AFC=\frac{TFC}{Q}\)
\(AC=\frac{TC}{Q}\)
(i) TC = 100 + Q3. Total cost has two components TFC and TVC.
(ii) TFC = is the total fixed cost which does not change with the level of output.
(iii) It is determined by putting the value of Q.
(iv) Given the total cost function T = 100+Q3
Q = units of output where Q = 10
Here TFC = 100 (TFC will not change with output changes)
TC 100 + (10)3
= 100 + 1000
TC = 1100
\(\therefore\)1100 = 100 + TVC
1100 - 100 = TVC
\(\therefore\)TVC = 1000
TVC = 1000, TC = 1100 \(\therefore\) TFC =?
TC = TFC + TVC
1100 = TFC + 1000
1100 - 1000 = TFC
\(\therefore\)TFC = 100
\(AFC=\frac{TFC}{Q}\)
TFC = 100, Q = 10
\(\therefore\) AFC = 10
\(AFC=\frac{TFC}{Q}\)
TVC = 1000, Q = 10
\(\therefore\) AVC = 100
\(AC=\frac{TC}{Q}\)
TC = 1100, Q = 10
\(\therefore\) AC = 110
or
AC = AFC + AVC
AFC = 10, AVC = 100
AC = 10 + 100
\(\therefore\) AC = 110
22.
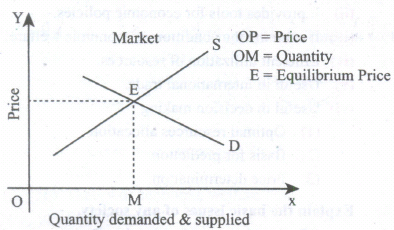
(i) Prof. Stigler states that "equilibrium is a position from which there is no net tendency to move".
(ii) It's referred to as disequilibrium.
(iii) Consumer's equilibrium occurs when he gets maximum satisfaction.
(iv) The equilibrium of the producer occurs when he gets maximum profit.
(v) Thus static equilibrium is based on given and constant prices, quantities, income, technology, population etc.
(vi) Equilibrium = Demand equal to supply
(vii) Equilibrium means state of rest or balance
23.
The concept of economic planning in India was the limited natural resources are utilized skillfully so as to achieve the desired goals.
(i) First Five Year Plan (1951 - 1956) :
Agriculture development of the country.
(ii) Second Five Year Plan (1956 - 1961) :
Industrial Development of the country.
(iii) Third Five Year Plan (1961 - 1966) :
To make the economy independent and to reach self active position to take off.
(iv) Fourth Five Year Plan (1969 - 1974) :
The two main objectives of this plan growth with stability and progressive achievement of self reliance.
(v) Fifth Five year Plan (1974 - 1979) :
In this plan top priority was given to agriculture, next cement industry and mines.
(vi) Sixth Five Year Plan (1980 - 1985) :
Poverty eradication and technological self reliance was the main objective of this plan.
(vii) Seventh Five Year Plan (1986 - 1991) :
The establishment of the self sufficient economy opportunities for productive employment.
(viii) Eighth Five Year Plan (1992 - 1997) :
The top priority was given to development of human resources, employment, education and public health.
(ix) Ninth Five Year Plan (1997 - 2002) :
The main focus of this plan growth with justice and equity
(x) Tenth Five Year Plan (2002- 2007) :
To double the per capita income of India next 10 years.
(xi) Eleventh Five Year Plan (2007 - 2012) :
"Faster and more inclusive growth was the main aim of this plan"
(xii) Twelfth Five Year Plan (2012 - 2017) :
Its main aim is "Faster, more inclusive and sustainable growth".
24.
Introduction :
(i) Small scale industries play an important role for the development of Indian economy.
(ii) 60 - 70% of total innovations in India comes from SSIs.
Provides employment:
(i) SSIs use labour intensive techniques.
(ii) They provide employment to artisans, technically qualified persons and professionals, people engaged in traditional arts, people in villages and unorganized sector.
(iii) The employment-capital ratio is high.
Brings balanced regional development:
(i) SSIs are set up in backward and rural areas.
(ii) This promotes decentralised development of industries.
(iii) They reduce congestion, slums, sanitation and pollution in cities since they are found outside city limits.
(iv) They improve the standard of living of people in suburban and rural areas
(v) The entrepreneurial talent is tapped from different regions.
Helps in mobilization of local resources:
(i) SSIs mobilize and use local resources like small savings, entrepreneurial talent etc of the entrepreneurs which might have remained idle.
(ii) It promotes traditional family skills and handicrafts.
Paves for optimisation of capital:
(i) SSIs needs less capital. They give quick profit due to shorter gestation period.
(ii) SSIs functions as a stabilizing force by providing high output-capital ratio and high employment capital ratio.
(iii) They encourage people living in rural areas to save and channelize them into industrial activities.
Promotes export:
(i) Since they do not need sophisticated machinery, import of machinery from abroad is not needed.
(ii) There is great demand for goods produced by SSIs.
(iii) They reduce the pressure on balance of payment as they earn foreign exchange
Complements large scale industries:
(i) They provide components, parts, accessories to large scale industries.
(ii) They serve as ancillaries to large scale units.
Meets consumer demand:
(i) SSIs produce a wide range of consumer products.
(ii) They serve as an anti-inflationary force by providing goods of daily use.
Develops entrepreneurship:
(i) SSIs help to develop entrepreneurs.
(ii) They help the job seekers to become job givers.
(iii) They promote self-employment and a spirit of self-reliance.
(iv) It increases the per capita income of India.
(v) There is development of backward areas and weaker sections.
(vi) It helps in equitable distribution of income.
25.
26.
Introduction:
(i) Marginal productivity theory of distribution was developed by Clark, Wicksteed and Walras.
(ii) This theory explains how the prices of various factors of production are determined.
Assumptions
(i) All the factors of production are homogeneous, can be substituted for each other and are perfectly mobile.
(ii) There is perfect competition in the factor & product market.
(iii) There is full employment with no technological change.
(iv) The theory is applicable only in long run.
(vi) The entrepreneurs aim at profit maximisation.
(vii) There is no government intervention in fixing the price of a factor.
Explanation:
(i) The reward for any factor of production is equal to the marginal productivity of that factor.
(ii) The greater the productivity of a factor higher will be its reward.
(iii) The price of a factor of production depends upon its productivity.
(vi) The price will be equal to marginal revenue product of that factor.
(v) Under certain conditions, the price of a factor will be equal to both the average and marginal products of that factor.
Marginal productivity under perfect competition:
.JPG)
(i) fig (a) x axis represents factor units.
(ii) y axis shows factor price & revenue.
MRP = Marginal revenue product curve.
ARP = Average revenue product curve.
AFC = Average factor cost curve.
MFC = Marginal factor cost curve.
(iii) AFC is horizontal & MFC coincides with it.
(iv) The firm is in equilibrium (maximum profit) when MFC = MRP at Q by employing ON units of factors & paying (OP price or NQ) where MFC = MRP = ARP.
(v) The price paid to the factor NQ is equal to MRP (NQ) and ARP (NQ) beyond Q no employer will employ factors because after that point, the price paid to the factor is more than MRP and ARP.
Marginal productivity under Imperfect competition:
.JPG)
(i) fig(b) AFC represents the price paid to the factors. It increases as the number of factors demanded by the employer increases.
(ii) As AFC rises, MFC lies above AFC. It represents the MC paid to the factors.
(iii) At the point Q, MFC = MRP, where the employer attains his maximum profit and so he stops employment of the factors at the point.
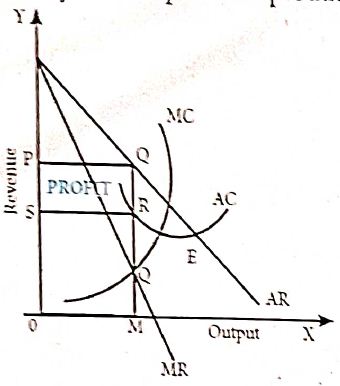
(iv) But the AC paid is NRSO and AR is NQ or OP
(v) Total revenue is NQPO.
(vi) Exploitation per unit of factor is RQQ
(vii) But the total number of factors is ON. Thus the total exploitation of factor by the employer is RQ XSR = PQRS (shaded area).
Criticisms:
(i) Factors of production are not homogeneous.
(ii) They cannot be substituted for each other.
(iii) It cannot be applied in the short run.
Conclusion:
This theory is also called "General Theory of Distribution" or "National Dividend Theory of distribution".
27.
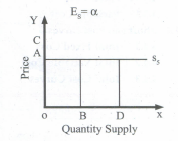
There are five types of elasticity supply. There are,
(1) Relative Elastic Supply: (ES> 1)
(i) The co-efficient of elastic supply is greater than 1 (ES> 1)
(ii) A unit change in the price causes more than one percent change in quantity supply of the commodity.
(2) Unitary Elastic Supply: (ES = 1)
(i) The co-efficient of elastic supply is equal to one (ES = 1)
(ii) A unit change in the price causes an equal change in quantity supply is called elastic supply.
(3) Relatively Inelastic Supply: (ES < 1)
(i) The co-efficient of elasticity is less than one (ES < 1)
(ii) A unit change in the price causes and less than one percent change in the quantity supply.
(4) Perfectly Inelastic Supply: (ES = 0) .
(i) The co-efficient of elasticity is equal to zero (ES = 0)
(ii) A unit change in the price causes no change in the quantity supply.
(5) Perfectly elastic supply: (ES = ∞)
(i) The co-efficient of elasticity of supply is infinity (ES = DC)
(ii) A unit change in the price causes an infinite change in the quantity supply.
28.
29.
Iso and quant are derived from the Greek language, meaning 'equal' and 'quantity'.
Definition:
Isoquant curve is a locus of points representing various combinations of two inputs capital and labour yielding the same output. It is also called equal product curve or product indifference curve.
Properties:
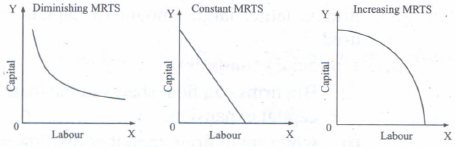
1. The isoquant curve has negative slope:
(i) Capital is being substituted by labour.
(ii) Isoquant has negative slope because of diminishing MRTS.
(iii) Constant MRTS (straight line) and increasing MRTS (concave) are also possible.
(iv) It depends on the nature of isoquant curve
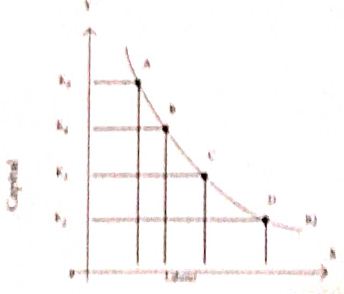
2. Isoquant curve is convex to origin:
The capital substituted per unit of labour goes on decreasing so the isoquant is convex to the origin.
3. Isoquant curves cannot intersect each other:
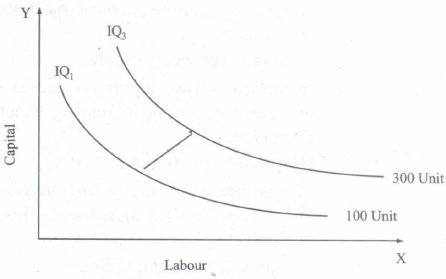
Point A lies on IQ1 and IQ2, Point C lies on IQ2, showing higher output Point B
lies on IQ1, showing lower output. C = A, B = A But C > B.
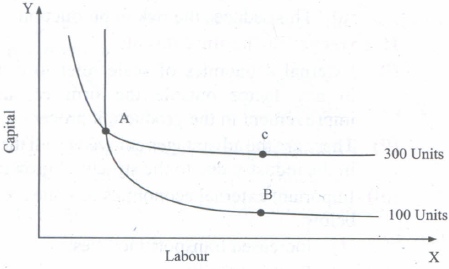
4. Upper isoquant curve represents a higher level of output:
Higher IQ2 shows higher output 200 units. Lower IQ1 shows lower output 100 units. IQ2 means the use of more factors than IQ1. Arrow shows increase in output with a right and upward shift of an isoquant curve.
5. Isoquant curve does not touch either x axis or y axis:
In IQ2 only capital is used and in IQ1 only labour is used.
.JPG)
Conclusion:
These are the properties of isoquant curves.
30.
31.
Introduction:
(i) In order to promote export and industrial growth SEZ was introduced in many countries.
(ii) India was one of the first in Asia to set up EPZ (Kandla, 1965).
(iii) SEZ covers free trade zones, export processing zones, industrial parks, economic and technology development zones, high-tech zones, science and innovation parks, free ports, enterprise zones.
Major objectives of SEZs
(i) To enhance foreign investment, to attract foreign direct investment and increase GDP.
(ii) To increase shares in global export.
(iii) To generate additional economic activity.
(iv) To create employment opportunities.
(v) To develop infrastructure facilities.
(vi) To exchange technology in the global market.
Characteristics:
(i) Geographically demarcated area with physical security.
(ii) administered by single authority.
(iii) Streamlined procedures.
(iv) Having separate customs area.
(v) Governed by more liberal economic laws.
(vi) Greater freedom to firms located in SEZs.
(vii) They need not respect the government's rules and regulations.
(viii) The social and environmental impacts were disastrous.
32.
The Problem of Choice:
(i) The problem of choice arises because of limited resources and unlimited wants, may relate to the allocation of resources between the goods for higher income group and the lower income group and the goods for defense and the civilians.
(ii) Since PPC is the locus of the combination of the goods the problem of choice will not arises when we choose any point on PPC.
The notion of scarcity:
(i) Every economy has scarce resources which can produce only limited amount of output even with the help of best technology.
(ii) PPC reflects the constraints imposed by the element of economic scarcity.
The solution of central problems:
(i) The solution of problem of what to produce involves the decision regarding the choice of location on the PPC.
(ii) Any point inside PPC indicates that the economy is using inefficient methods of production and inefficient combination of resources.
Conclusion:
(i) Thus the basic problems of the economy are solved with the help of PPC.
33.
| Wealth | Welfare | Scarcity | Growth |
| Adam Smith classical era. |
Alfred Marshall- neo classical era. |
Lionel Robbins new age. |
Paul Samuelson modern age. |
| An Inquiry into nature and causes of Wealth of Nations (1776). |
Principles of |
An Essay on the nature and Significance of Economic Science (1932). |
Economics studies how men and society choose with or without the use of money, to employ scarce productive resources which could have alternative uses, to produce various commodities over time and distribute them for consumption now and in the future among various people and groups of society. |
| Economics is the science of wealth. | Economics is a study of mankind in the ordinary business of life, it examines that part of individual and social action which is most closely connected with the attainment and with the use of material requisites of well being. It studies wealth and man. |
Economics is a science which studies human behaviour as a relationship between ends and scarce means which have alternative uses. |
Economics deals with how the society uses the limited resources for alternative uses. |
| Deals with only the goods which are scarce and have money value |
wealth and welfare of man is important. | Human behaviour regarding choice is important. |
It covers production, distribution and consumption. |
| Deals with consumption, production, exchange, distribution of wealth. |
Only material welfare is considered, differentiates between material and immaterial things. |
Economic problem arises because of scarcity of resources. |
Economics is a social science. |
| By introducing welfare, economics becomes inexact. |
Ethical aspects are not considered so Economics is exact |
||
| Welfare definition makes Economics classificatory. | Economics is a positive science. |
||
| Economics is a science of individual behaviour. |
|||
| Both material and immaterial activities are considered. |
34.
35.
Short run equilibrium:
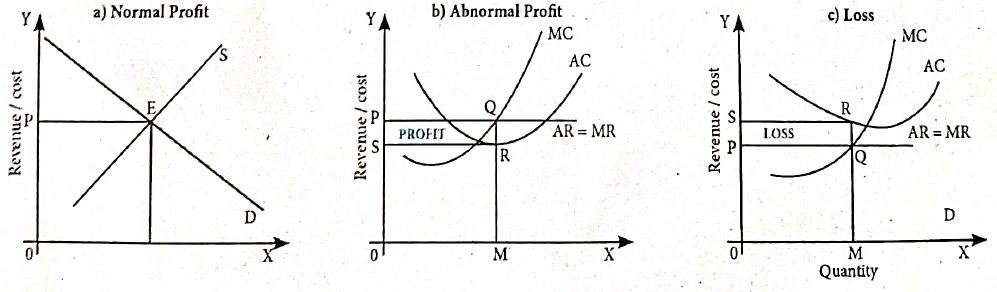
In diagram (a) the demand and supply of all firms interact and price OP is fixed.
(i) In diagram (b) the AC is less than the price.
(ii) At equilibrium MC = MR, AR = QM, AC = RM. Profit per unit is RQ
(iii) Total profit is PQRS.
(iv) In diagram (c) AC is greater than AR.
(v) At equilibrium AR = QM, AC = RM, loss per unit is RQ.
(vi) Total loss is PQRS.
(vii) When there is abnormal profit, new firms will enter the industry
(viii) Supply increases, price falls, profits become normal.
Long run equilibrium:
.JPG)
(i) All factors are variable. Firms earn normal profit.
(ii) There is no tendency for new firms to enter or leave the industry.
(iii) Equilibrium is at minimum point of LAC.
(iv) At point E, LMC = MR = AR = LAC.
(v) AC = QM, AR = QM.
(vi) Profit is normal.
(vii) Long run equilibrium price is lower than short run equilibrium price.
(viii) Long run equilibrium quantity is larger than short run equilibrium quantity.
36.
Average fixed cost:
1. It refers to the fixed cost per unit of output.
2. It declines as output increases as fixed cost is constant.
3. It never touches the axis.
4. It is rectangular hyperbola.
.JPG)
Average variable cost:
1. It is the variable cost per unit of output.
2. It initially declines and then increases with the increase of output
3. This is due to law of returns.
4. AVC curve is a 'U' shaped curve.
.JPG)
Average total cost or average cost:
1. It is got by dividing TC by Q or by adding AFC and AVC.
2. It is u shaped.
3. Initially it declines, reaches minimum when the plant is used optimally & rises beyond the optimum output.
4. This is due to the law of variable proportions.
.JPG)
Marginal cost:
1. It is the change in total cost resulting from producing one extra unit of output.
2. First it falls due to more efficient use of variable factors.
3. It increases after the lowest point and it slopes upward.
4. It is 'u' shaped.
.JPG)
| Q (in unit) | TFC in (Rs) | TVC in (Rs) | TC in (in Rs)TFC + TVC | ATC (TC/Q)(in Rs) | AFC in(Rs) | AVC in(Rs) | ATC (AFC + AVC)(in Rs) |
| 0 | 1000 | 0 | 1000 | α | 0 | 0 | 0 |
| 1 | 1000 | 200 | 1200 | 1200 | 1000 | 200 | 1200 |
| 2 | 1000 | 300 | 1300 | 650 | 500 | 150 | 650 |
| 3 | 1000 | 400 | 1400 | 466 | 333 | 133 | 466 |
| 4 | 1000 | 600 | 1600 | 400 | 250 | 150 | 400 |
| 5 | 1000 | 900 | 1900 | 380 | 200 | 180 | 380 |
37.
\(\text { TC }=10+Q^{3} \)
\(A C=\frac{10}{Q}+\frac{Q^{3}}{Q}=\frac{10}{Q}+Q^{2}=\frac{10}{5}+5^{2}=2+25=27 \)
\(\text {AVC }=\frac{Q^{3}}{Q}=Q^{2}=5^{2}=25 \)
\(\text {TFC }=10 \)
\(\text {AFC }=\frac{10}{\mathrm{Q}}=\frac{10}{5}=2 \)
\(Ans; \mathrm{AC}=27 ; \quad \mathrm{AVC}=25 ; \quad \mathrm{TFC}=10 ; \quad \mathrm{AFC}=2.\)
38.
Introduction:
(i) Jawaharlal Nehru one of the chief builders of modern India was the first Prime Minister of Independent India.
(ii) He was a great patriot, thinker and statesman.
Democracy and secularism:
(i) Nehru believed in democracy, free speech, civil liberty, adult franchise, the Rule of law and Parliamentary democracy.
(ii) He favoured secularism.
(iii) Secularism means equal respect for all religions. In our country we have Hinduism, Islam, Christianity, Buddhism, Jainism, Sikhism and so on.
(iv) But there is no domination by religious majority.
Planning:
(i) Nehru introduced planning in our country.
(ii) Planning was linked with industrialisation and self-reliance.
(iii) Nehru contributed to the advancement of science, research, technology and industrial development.
(iv) Many IITs and Research Institutions were established.
Democratic socialism:
(i) Nehru wanted a socialistic pattern of society.
(ii) His socialism is democratic socialism.
Conclusion:
(i) Nehru's views on economics and social problems are found in his innumerable speeches and in the books he wrote.
39.
Introduction:
Indian economy is the seventh largest economy of the world. Its features are:
Mixed economy:
(i) In India private and public sectors co-exist.
(ii) Some fundamental and heavy industries are under public sector.
(iii) Due to liberalization private sector's importance has increased.
Agriculture:
(i) 60 % of Indians depend on agriculture for their livelihood.
(ii) 17 % of GDP is got from agricultural sector.
(iii) Green revolution and inventions in biotechnology have made agriculture self sufficient.
(iv) The export of fruits, vegetables, spices, tobacco, animal skin, vegetable oils also add to foreign exchange earning.
An emerging market:
(i) India has emerged as a vibrant economy sustaining stable GDP growth rate even when there was global downtrend.
(ii) This has attracted foreign capital through FDI and FII.
(iii) India is in the 7th position in terms of nominal GDP and 3rd in terms of purchasing power parity.
(iv) India is one among the G20 countries.
Fast growing economy:
(i) With a growth rate of 7.1% in GDP India is the world's fastest growing economy in 2016-17 next to China.
Fast growing service sector:
(i) There has been growth in technical sectors like Information Technology, BPO.
(ii) These emerging services have helped the country to go global.
Large domestic consumption:
(i) The standard of living has improved a lot. There is rapid increase in domestic consumption.
Rapid growth of urban areas:
(i) There has been a rapid growth of urban areas in India after Independence. Improved connectivity in transport and communication, education and health have speeded up urbanization.
Stable macroeconomy:
(i) India is one of the most stable economies of the world.
(ii) The current year's economic survey represents the Indian economy to be a "heaven of macroeconomic stability, resilience and optimism".
Demographic dividend:
(i) The human capital is young.
(ii) They are young, skilled and trained enough to maximize growth.
(iii) This has invited foreign investments and outsourcing opportunities.

11th Standard Syllabus & Materials
11th Standard
TN 11th Tamil பீடு பெற நில் - செய்யுள் - காவடிச்சிந்து Important Questions And Answers Study Material - QB365 Set A
NEW11th Standard
TN 11th Tamil பீடு பெற நில் - உரைநடை - மலை இடப்பெயர்கள் : ஓர் ஆய்வு Important Questions And Answers Study Material - QB365 Set A
NEW11th Standard
TN 11th Tamil மாமழை போற்றுதும் - துணைப்பாடம் - யானை டாக்டர் Important Questions And Answers Study Material - QB365 Set A
NEW11th Standard
TN 11th Tamil மாமழை போற்றுதும் - செய்யுள் - ஐங்குறுநூறு Important Questions And Answers Study Material - QB365 Set A



Tamilnadu Stateboard 11th Standard Subjects

Maths

Commerce
Economics

Biology

Business Maths and Statistics

Accountancy

Computer Science

Physics

Chemistry
Maths
Biology
Economics
Physics
Chemistry

History
Business Maths and Statistics

Computer Science
Accountancy

Computer Applications
History
Computer Technology
Commerce
Computer Applications
Computer Technology

Tamil

English

French
Tamilnadu Stateboard Standards
