100% FREE ACCESS
9th Standard CBSE Syllabus & Materials
9th Standard CBSE
CBSE 9th Science Is matter around us pure? - New Model Questions Papers Study Material - QB365 Set A
NEW9th Standard CBSE
CBSE 9th Science Matter in our surroundings - New Model Questions Papers Study Material - QB365 Set A
NEW9th Standard CBSE
CBSE 9th Mathematics Heron's Formula Sample Question Papers Study Material - QB365 Set A
NEW9th Standard CBSE
CBSE 9th Mathematics Circles Sample Question Papers Study Material - QB365 Set A
NEW9th Standard CBSE
CBSE 9th Mathematics Quadrilaterals Sample Question Papers Study Material - QB365 Set A
NEW9th Standard CBSE
CBSE 9th Mathematics Triangles Sample Question Papers Study Material - QB365 Set A

Published on: 26/09/2019
Probability
Download CBSE Class 9th Standard CBSE Mathematics question papers, sample papers, important questions, and previous year solved papers in PDF format. Get free study materials, NCERT solutions, and exam preparation resources for Class 9th Standard CBSE Mathematics
Questions + Answers key
Take MCQ Mathematics Test
1.
Two dice are thrown 400 times. Each time sum of two numbers appearing on the tops is noted as given in the following table:
| Sum | Frequency |
| 2 | 14 |
| 3 | 20 |
| 4 | 32 |
| 5 | 45 |
| 6 | 62 |
| 7 | 65 |
| 8 | 60 |
| 9 | 43 |
| 10 | 36 |
| 11 | 18 |
| 12 | 5 |
What is the probability of getting a sum
(i) 5
(ii) more than 10
(iii) between 5 and 10
2.
Given below is the frequency distribution of salary (in rupees) of 80 workers in a factory.
| Salary (in Rs) | No. of Workers |
| 1000-2000 | 12 |
| 2000-3000 | 18 |
| 3000-4000 | 22 |
| 4000-5000 | 28 |
If a worker is selected at random, find the probability that his salary is
(i) Less than Rs 3000
(ii) More than or equal to Rs 1000
(iii) More than or equal to Rs 2000 but less than Rs 4000
3.
Following is the data about the months of birth of 40 students in class IX.
| Student No | 1 | 2 | 3 | 4 | 5 | 6 | 7 | 8 | 9 | 10 | 11 | 12 | 13 | 14 | 15 | 16 | 17 | 18 | 19 | 20 | 21 | 22 | 23 | 24 | 25 | 26 | 27 | 28 | 29 | 30 | 31 | 32 | 33 | 34 | 35 | 36 | 37 | 38 | 39 | 40 |
| Month | Feb | Jan | Jul | Jun | Mar | Feb | Feb | Feb | Nov | Jan | Jan | Dec | May | Jun | Jun | Jul | Jun | Nov | Dec | Jun | Jul | Jun | Aug | Dec | Jun | Mar | Jul | Jul | Jun | Dec | Sep | Mar | Jan | Dec | Jun | Dec | Sep | Mar | Jan | Nov |
One student is chosen at random. Find the probability that the student chosen:
(i) was born in June
(ii) was not born in the month of June
4.
Three coins were tossed 30 times simultaneously. Each time the number of heads occurring was noted down as follows
| No. of times | 1 | 2 | 3 | 4 | 5 | 6 | 7 | 8 | 9 | 10 | 11 | 12 | 13 | 14 | 15 | 16 | 17 | 18 | 19 | 20 | 21 | 22 | 23 | 24 | 25 | 26 | 27 | 28 | 29 | 30 |
| Number of head occurs | 0 | 1 | 2 | 2 | 1 | 2 | 3 | 1 | 3 | 0 | 1 | 3 | 1 | 1 | 2 | 2 | 0 | 1 | 2 | 1 | 3 | 0 | 0 | 1 | 1 | 2 | 3 | 2 | 2 | 0 |
Prepare frequency distribution table for the data given below.
5.
The data regarding the number of children in a house of a colony which has 250 houses was collected and is recorded below. The houses with number of children are recorded below:
| No.of children | No.of houses |
| 1 child | 48 |
| 2 boys | 72 |
| 2 girls | 63 |
| 1 boy and 1 girl | 55 |
| No child | 12 |
One house is selected at random. What is the probability that it is a house which has
(a) 2 boys?
(b) more than one child?
(c) no children at all?
6.
Over the past 200 working days, the number of defective parts produced by a machine are given in the following table:
| No.of defective parts |
Day |
| 0 | 50 |
| 1 | 32 |
| 2 | 22 |
| 3 | 18 |
| 4 | 12 |
| 5 | 12 |
| 6 | 10 |
| 7 | 10 |
| 8 | 10 |
| 9 | 8 |
| 10 | 4 |
| 11 | 4 |
| 12 | 4 |
| 13 | 4 |
Determine the probability that tomorrow's output will have not more than 5 defective parts.
7.
Given below is the frequency distribution of salary in Rs of 80 workers in a factory.
| Salary | No.of workers |
| 1000-2000 | 8 |
| 2000-3000 | 14 |
| 3000-4000 | 20 |
| 4000-5000 | 24 |
| 5000-6000 | 14 |
Find the probability that the salary of a worker selected at random is:
(i) Less than 4000
(ii) More than or equal to 3000
(iii) More than or equal to 2000 but less than 5000
8.
In a survey of 200 men, it was found that 65 men take only coffee, 35 take only tea, 25 do not take either and the rest take both coffee and tea. Find the probability that a man selected at random:
(a) takes coffee
(b) takes only tea
9.
The percentage of marks obtained by a student in the monthly unit tests are given below:
| Unit test | No.of marks obtained |
| I | 76 |
| II | 52 |
| III | 60 |
| IV | 95 |
| V | 43 |
Based on this data, find the probabi lity that the
(a) student gets less than 60% marks in a unit test
(b) student gets at least 60% marks in a unit test
10.
Three coins are tossed simultaneously 250 times. The distribution of various outcomes is listed below:
(i) Three tails: 30
(ii) Two tails: 70
(iii) One tail : 90
(iv) No tail: 60
Find the respective probability of each event and check that the sum of all the probabilities is 1.
11.
In a cricket match, a batsman hits a boundary 6 times out of 30 balls she plays.Find the probability that she did not hit a boundary.
12.
Eleven bags of wheat flour, each marked 5 kg, actually contained the following weights of flour (in kg):
4.97, 5.05 ,5.08 ,5.03 ,5.00 ,4.86, 5.08, 4.98 ,5.04, 5.07 ,5.00
Find the probability that any of these bags chosen at random contains more than 5 kg of flour.
13.
To know the opinion of the students about the subject statistics, a survey of 200 students was conducted. The data is recorded in the following table:
| Opinion | Number of students |
| like | 135 |
| dislike | 65 |
Find the probability that a student chosen at random
(i) likes statistics,
(ii) does not like it
14.
In a particular section of Class IX, 40 students were asked about the months of their birth, the following graph was prepared for the data so obtained. Find the probability that a student of the class was born in August.
15.
1500 families with 2 children were selected randomly, and the following data were recorded:
| Number of girls in a family | 2 | 1 | 0 |
| Number of families | 475 | 814 | 211 |
Compute the probability of a family, chosen at random, having
(i) 2 girls (ii) 1 girl (iii) No girl
also, check whether the sum of these probabilities is 1.
1.
(i)\(P(5)=\frac{45}{400}=\frac{9}{80}\)
(ii) P(more than 10)\(=\frac{18+5}{400}=\frac{23}{400}\)
(iii) P(between 5 and 10)\(=\frac{62+65+60+43}{400}\)
\(=\frac{230}{400}=\frac{23}{40}\)
2.
(i) Probability of getting salary less than Rs 3000
\(=\frac{12+18}{80}\)
\(=\frac{30}{80}=\frac{3}{8}\)
(ii) Probability of getting salary more than or equal to Rs 1000
\(=\frac{12+18+22+28}{80}=\frac{80}{80}=1\)
(iii) Probability of getting salary more or equal to Rs 2000 but less than Rs 4000
\(=\frac{18+22}{80}\)
\(=\frac{40}{80}=\frac{1}{2}\)
3.
| Month | Students born |
| Jan | 5 |
| Feb | 4 |
| Mar | 4 |
| May | 1 |
| Jun | 9 |
| Jul | 5 |
| Aug | 1 |
| Sep | 2 |
| Nov | 3 |
| Dec | 6 |
(i) Let E1 be the event of student born in June
\(\therefore P(E_1)=\frac{9}{40}\)
(ii) Let E2 be the event of students not born in June
Favourable outcomes =(40 - 9) = 31
\(\therefore P(E_2)=\frac{31}{40}\)
4.
| Outcomes | 0 head | 1 head | 2 head | 3 head |
| Frequency | 6 | 10 | 9 | 5 |
5.
\((a)\frac { 36 }{ 125 } \)
\((b)\frac { 19 }{ 25 } \)
\((c)\frac { 6 }{ 125 } \)
6.
\(\frac { 73 }{ 100 } \)
7.
\((i)\frac { 21 }{ 40 }\)
\((ii)\frac { 29 }{ 40 }\)
\((iii)\frac { 29 }{ 40 } \)
8.
\((a)\frac { 7 }{ 10 }\)
\((b)\frac { 7 }{ 40 } \)
9.
\((a)\frac { 2 }{ 5 } \)
\((b)\frac { 3 }{ 5 } \)
10.
\((i)\frac { 3 }{ 25 }\)
\((ii)\frac { 7 }{ 25 }\)
\((iii)\frac { 9 }{ 25 }\)
\((iv)\frac { 6 }{ 25 } \)
11.
Let E be the event of hitting the boundary.
Then,
\(P(E)=\frac { Number\ of\ times\ the\ batswoman\ hits\ the\ boundary }{ Total\ number\ of\ balls\ she\ plays } \)
\(=\frac { 6 }{ 30 } =\frac { 1 }{ 5 } =0.2\)
Probability of not hitting the boundary
= 1- Probability of hitting the boundary
= 1- P(E) = 1 - 0.2 = 0.8
12.
Total bags = 11
More than 5 kg of flour = 6
Prob.of more than 5 kg of flour = \(\frac { 6 }{ 11 } \)
13.
Total number of students = 200
(i) Number of students who like statistics = 135
Probability that a student chosen at random likes statistics=\(\frac { 135 }{ 200 } =\frac { 27 }{ 40 } \)
(ii) Number of students who do not like statistics=65
Probability that a student chosen at random does not like it= \(\frac { 65 }{ 200 } =\frac { 13 }{ 40 } \)
Aliter:
Probability that a student chosen at random does not like statistics
= 1 - probability that a student chosen at random likes statistics
=\(1-\frac { 27 }{ 40 } =\frac { 13 }{ 40 } \)
14.
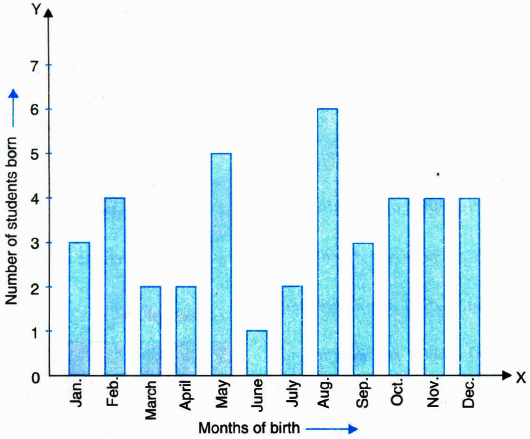
Total number of students born in the year
= 3 + 4 + 2 + 2 + 5 + 1 + 2 + 6 + 3 + 4 + 4 + 4 = 40
Number of students born in August = 6
. Probability that a student of the class was born in August =\(\frac { 6 }{ 40 } =\frac { 3 }{ 20 } \)
15.
Total number of families
= 475 + 814 + 211 = 1500
(i) Probability of a family, chosen at random, having 2 girls = \(\frac { 475 }{ 1500 } =\frac { 19 }{ 60 } \)
(ii) Probability of a family, chosen at random, having 1 girl = \(\frac { 814 }{ 1500 } =\frac { 407 }{ 750 } \)
(iii) Probability of a family, chosen at random, having no girl = \(\frac { 211 }{ 1500 }\)

9th Standard CBSE Syllabus & Materials
9th Standard CBSE
CBSE 9th Mathematics Lines and Angles Sample Question Papers Study Material - QB365 Set A
NEW9th Standard CBSE
CBSE 9th Mathematics Introduction to Euclid's Geometry Sample Question Papers Study Material - QB365 Set A
NEW9th Standard CBSE
CBSE 9th Mathematics Linear Equations in Two Variables Sample Question Papers Study Material - QB365 Set A
NEW9th Standard CBSE
CBSE 9th Mathematics Coordinate Geometry Sample Question Papers Study Material - QB365 Set A



CBSE 9th Standard CBSE Subjects
CBSE Standards