100% FREE ACCESS
9th Standard CBSE Syllabus & Materials
9th Standard CBSE
CBSE 9th Science Is matter around us pure? - New Model Questions Papers Study Material - QB365 Set A
NEW9th Standard CBSE
CBSE 9th Science Matter in our surroundings - New Model Questions Papers Study Material - QB365 Set A
NEW9th Standard CBSE
CBSE 9th Mathematics Heron's Formula Sample Question Papers Study Material - QB365 Set A
NEW9th Standard CBSE
CBSE 9th Mathematics Circles Sample Question Papers Study Material - QB365 Set A
NEW9th Standard CBSE
CBSE 9th Mathematics Quadrilaterals Sample Question Papers Study Material - QB365 Set A
NEW9th Standard CBSE
CBSE 9th Mathematics Triangles Sample Question Papers Study Material - QB365 Set A

Published on: 09/10/2019
Statistics
Download CBSE Class 9th Standard CBSE Mathematics question papers, sample papers, important questions, and previous year solved papers in PDF format. Get free study materials, NCERT solutions, and exam preparation resources for Class 9th Standard CBSE Mathematics
Questions + Answers key
Take MCQ Mathematics Test
1.
The mean of 10,12,16,20,p and 26 is 17. Find the value of p.
2.
The mean of 10,12,18,13,x and 17 is 15. Find the value of x.
3.
Calculate mean of first 5 prime numbers.
4.
Find the mean of first 10 multiples of 7?
5.
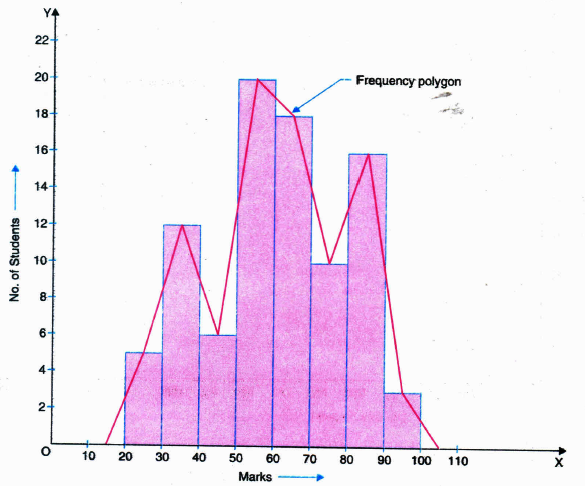
Draw a histogram and frequency polygon of the following data:
| Marks | No.of students |
|---|---|
| 20-30 | 5 |
| 30-40 | 12 |
| 40-50 | 6 |
| 50-60 | 20 |
| 60-70 | 18 |
| 70-80 | 10 |
| 80-90 | 16 |
| 90-100 | 3 |
6.
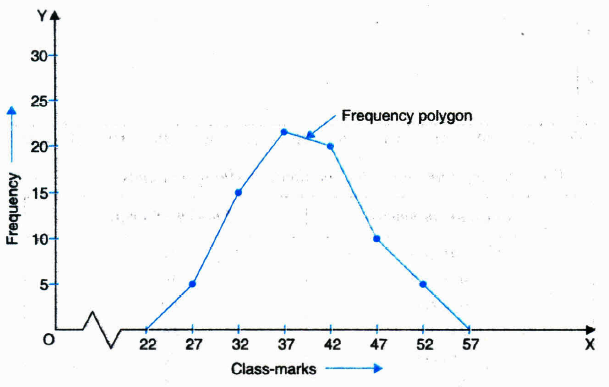
Draw a frequency polygon to represent the following information:
| Class | Frequency |
|---|---|
| 25-29 | 5 |
| 30-34 | 15 |
| 35-39 | 23 |
| 40-44 | 20 |
| 45-49 | 10 |
| 50-54 | 7 |
7.
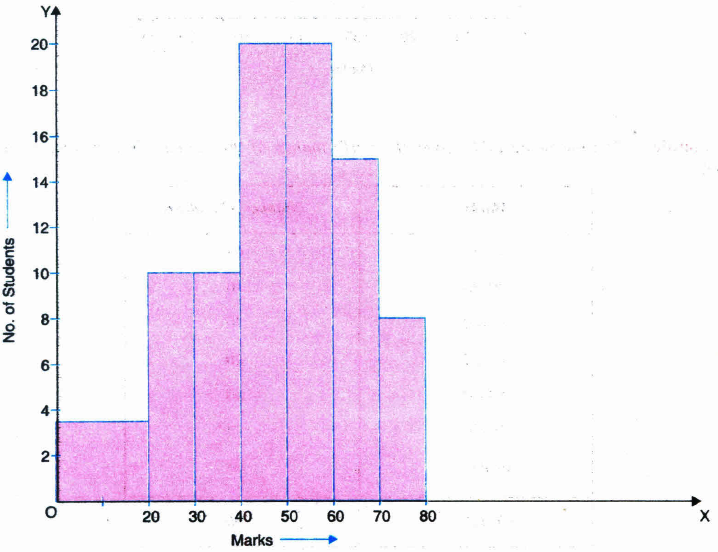
The following table gives the performance of 90 students in a mathematics test of 100 marks.
| Marks | Number of students |
|---|---|
| 0-20 | 07 |
| 20-30 | 10 |
| 30-40 | 10 |
| 40-50 | 20 |
| 50-60 | 20 |
| 60-70 | 15 |
| 70-above | 08 |
| Total | 90 |
Represent the given information with the help of a histogram.
8.
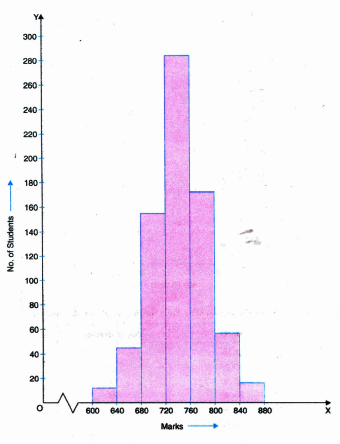
The marks scored by 750 students in examination are given in the form a frequency distribution table.
| Marks | No. of students |
| 600-640 | 16 |
| 640-680 | 45 |
| 680-720 | 156 |
| 720-760 | 284 |
| 760-800 | 172 |
| 800-840 | 59 |
| 840-880 | 18 |
Draw a histogram to represent the above data.
9.
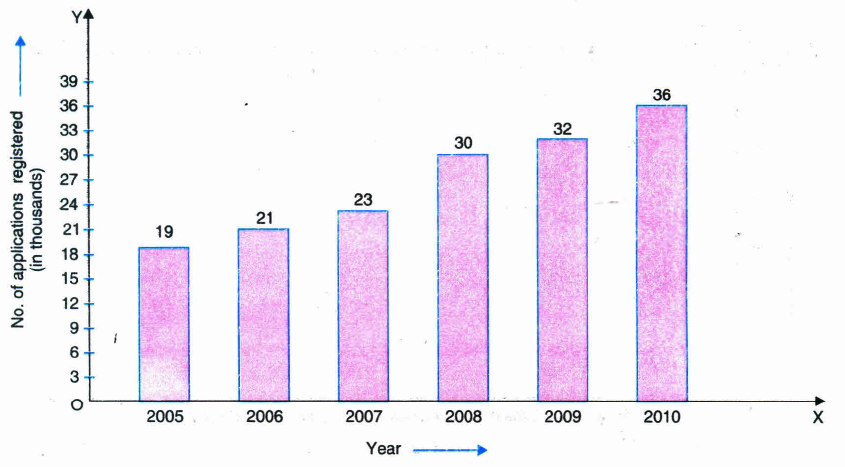
The following data gives the number (in thousands) of applicants registered with an Employment Exchange during 2005-2010.
| Year | No.of applications registered (in thousands) |
| 2005 | 19 |
| 2006 | 21 |
| 2007 | 23 |
| 2008 | 30 |
| 2009 | 32 |
| 2010 | 36 |
Construct a bar graph to represent the above data.
10.
The class marks of a frequency distribution are 104, 114, 124, 134, 144, 154, 164. Find the class size and class intervals.
1.
\(\frac{10+12+16+20+p+26}{6}=17\)
\(\Rightarrow\) 84 + p = 102
\(\Rightarrow\) p = 102 - 84
\(\Rightarrow\) p = 18.
2.
According to the question,
\(\frac {10+12+18+13+x+17}{6}=15\)
\(\Rightarrow\) x + 70 = 90
\(\Rightarrow\) x = 20
3.
First 5 prime numbers are 2,3,5,7,11
Their mean \(= \frac {2+3+5+7+11}{5}=\frac{28}{5}=5.6\)
4.
First 10 multiples of 7 are
7,14,21,28,35,42,49,56,63,70
Their mean
\(\frac {7+14+21+28+35+42+49+56+63+70}{10} = \frac {385}{10}=38.5\)
5.
6.
We shall first make the class intervals continuous. Then, the modified table is as follows:
| Class | Class-marks | Frequency |
|---|---|---|
| 24.5-29.5 | 27 | 5 |
| 29.5-34.5 | 32 | 15 |
| 34.5-39.5 | 37 | 23 |
| 39.5-44.5 | 42 | 20 |
| 44.5-49.5 | 47 | 10 |
| 49.5-54.5 | 52 | 7 |
| Total | 80 |
7.
Adjusted frequency a class \(\frac {Minimum \ class \ size}{Class \ size}\times {Frequency \ of \ the \ class}\)
Minimum class size = 10
| Marks | Number of students | Adjusted frequency |
|---|---|---|
| 0-20 | 07 | \(\frac {10}{20}\times 7 = 3.5\) |
| 20-30 | 10 | \(\frac {10}{10}\times 10 = 10\) |
| 30-40 | 10 | \(\frac {10}{10}\times 10 = 10\) |
| 40-50 | 20 | \(\frac {10}{10}\times 20 = 20\) |
| 50-60 | 20 | \(\frac {10}{10}\times 20 = 20\) |
| 60-70 | 15 | \(\frac {10}{10}\times 15 = 15\) |
| 70-80 | 08 | \(\frac {10}{10}\times 08 = 08\) |
8.
9.
10.
Class size = 114 -104 = 10
\(\frac {10}{2}=5\)
The class intervals are
104-5___104+5, i.e., 99-109;
114-5___ 114+5, i.e, 109-119;
124-5___ 124+5, i.e., 119-129;
134-5___ 134+5, i.e., 129-139;
144-5___ 144+5, i.e., 139-149;
154-5___ 154+5, i.e., 149-159;
164-5___ 159-169.

9th Standard CBSE Syllabus & Materials
9th Standard CBSE
CBSE 9th Mathematics Lines and Angles Sample Question Papers Study Material - QB365 Set A
NEW9th Standard CBSE
CBSE 9th Mathematics Introduction to Euclid's Geometry Sample Question Papers Study Material - QB365 Set A
NEW9th Standard CBSE
CBSE 9th Mathematics Linear Equations in Two Variables Sample Question Papers Study Material - QB365 Set A
NEW9th Standard CBSE
CBSE 9th Mathematics Coordinate Geometry Sample Question Papers Study Material - QB365 Set A



CBSE 9th Standard CBSE Subjects
CBSE Standards