100% FREE ACCESS
9th Standard CBSE Syllabus & Materials
9th Standard CBSE
CBSE 9th Science Is matter around us pure? - New Model Questions Papers Study Material - QB365 Set A
NEW9th Standard CBSE
CBSE 9th Science Matter in our surroundings - New Model Questions Papers Study Material - QB365 Set A
NEW9th Standard CBSE
CBSE 9th Mathematics Heron's Formula Sample Question Papers Study Material - QB365 Set A
NEW9th Standard CBSE
CBSE 9th Mathematics Circles Sample Question Papers Study Material - QB365 Set A
NEW9th Standard CBSE
CBSE 9th Mathematics Quadrilaterals Sample Question Papers Study Material - QB365 Set A
NEW9th Standard CBSE
CBSE 9th Mathematics Triangles Sample Question Papers Study Material - QB365 Set A

Published on: 26/09/2019
Statistics
Download CBSE Class 9th Standard CBSE Mathematics question papers, sample papers, important questions, and previous year solved papers in PDF format. Get free study materials, NCERT solutions, and exam preparation resources for Class 9th Standard CBSE Mathematics
Questions + Answers key
Take MCQ Mathematics Test
1.
The mean of five observations, x,x + 2,x + 4,x + 6 and x + 8 is 23. Find the mean of last four observations,.
2.
The mean of the 10 observations 15,17,23,18,17,25,p,18,20,12 is 18. Find the value of p.
3.
If the mean of five observations x,x + 2,x +4, x +6,x + 8 is 13, then find the value of x.
4.
If the observations, of 6,7,x-2,x,17,20 are written in ascending order and their median is 16, find the value of 'x'. Using the value of x, also find of given numbers.
5.
If the mean of x,x +2,x +4,x +6,x + 8, is 24, find the value of x.
6.
Give one example of a situation in which
(i) the mean is an appropriate measure of central tendency.
(ii) the mean is not an appropriate measure of central tendency but the median is an appropriate measure of central tendency.
7.
Find the mode of 14,25,14,28,18,17,18,14,23,22,14,18
8.
The following observations have been arranged in ascending order. If the median of the data is 63, find the value of x.
29,32,48,50,x,x+2,72,78,84,95
9.
In a Mathematics test given to 15 students, the following marks (out of 100) are recorded:
41,39,48,52,46,62,54,40,96, 52,98,40,42,52,60
Find the mean, median and mode of this data.
10.
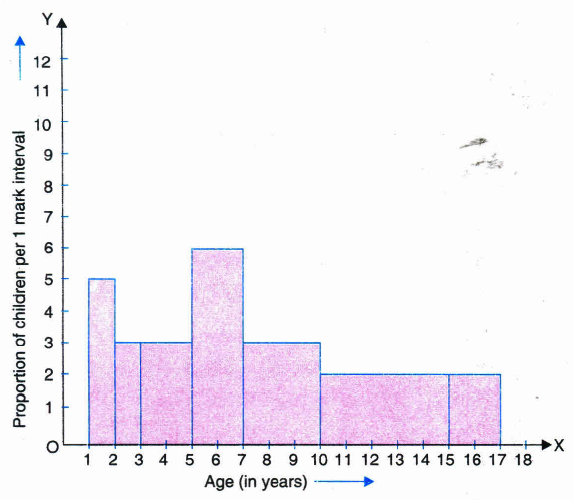
A random survey of the number of children of various age groups playing in a park was found as follows:
| Age (in years) | Number of children |
| 1-2 | 5 |
| 2-3 | 3 |
| 3-5 | 6 |
| 5-7 | 12 |
| 7-10 | 9 |
| 10-15 | 10 |
| 15-17 | 4 |
Draw a histogram to represent the data above.
11.
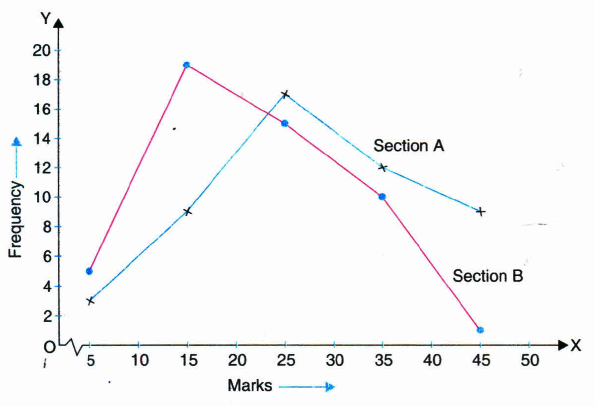
The following table gives the distribution of students of two sections according to the marks obtained by them:
| Section A Section B | |||
| Marks | Freqeuncy | Marks | Freqency |
| 0-10 | 3 | 0-10 | 5 |
| 20-20 | 9 | 10-20 | 19 |
| 20-30 | 17 | 20-30 | 15 |
| 30-40 | 12 | 30-40 | 10 |
| 40-50 | 9 | 40-50 | 1 |
Represent the marks of the students of both the sections on the same graph by two frequency polygons. From the two polygons compare the performance of the two sections.
12.
The length of 40 leaves of a plant are measured a correct one millimeter, and the obtained data is represented in the following table:
| Length (in mm) | Number of leaves |
| 118-126 | 3 |
| 127-135 | 5 |
| 136-144 | 9 |
| 145-153 | 12 |
| 154-162 | 5 |
| 163-171 | 4 |
| 172-180 | 2 |
(i) Draw a histogram to represent the given data.
(ii) Is there any suitable graphical representation for the same data?
(iii) Is it correct to conclude that the maximum number of leaves are 153 mm long? Why?
13.
The blood groups of 30 students of Class VIII are recorded as follows:
A,B,O,O,AB,O,A,O,B,A,O,B, A,O,O,
A,AB,O,A,A,O,O,AB,B,A,O,B,A,B,O.
Represent this data in the form of a frequency distribution table. Which is the most common and which is the rarest, blood group among these students.
14.
Classify the data as primary or secondary data.
(i) Number of students
(ii) Number of fans un our school.
(iii) Electricity bills of our house for last two years.
(iv) Election results obtained from television or newspaper.
(v) Literacy rate figures obtained from Educational Survey.
15.
Give five examples of data that you can collect from your day-to-day life.
1.
24
2.
15
3.
9
4.
71,13.66
5.
20
6.
(i) Mean marks of the students of a class in a test in mathematics.
(ii) Average beauty.
7.
The given data is
14,25,14,28,18,17,18,14,23,22,14,18
Arranging the data in ascending order, we have
14,14,14,14,17,18,18,18,22,23,25,28
Here, 14 occurs most frequently (4 times)
\(\therefore\) Mode = 14.
8.
Number of observations (n) = 10, which is even.
\(\therefore\) Median
\(=\frac { { \left( \frac { n }{ 2 } \right) }^{ th }observation+{ \left( \frac { n }{ 2 } +1 \right) }^{ th }observation }{ 2 } \)
\(=\frac { { \left( \frac { 10 }{ 2 } \right) }^{ th }observation+{ \left( \frac { 10 }{ 2 } +1 \right) }^{ th }observation }{ 2 } \)
\(=\frac { { 5 }^{ th }observation+{ 6 }^{ th }observation }{ 2 } \)
\(=\frac { x+\left( x+2 \right) }{ 2 } =x+1\)
According to the question,
x + 1 = 63
\(\Rightarrow\) x = 63 - 1
\(\Rightarrow\) x = 62
Hence, the value of x is 62.
9.
(i) Mean
\(Mean = \frac { Sum\ of\ all\ the\ observations }{ Total\ number\ of\ observations } \)
\(=\frac {41+39+48+52+46+62+54+40+96+52+98+40+42+52+60}{15}\)
\(=\frac {822}{15}=54.8\)
(ii) Median
Arranging the given data in descending order, we have
98,96,62,54,52,52,48,46,42,41,40,40,39
Number of observations (n) = 15, which is odd.
\(\therefore\) Median \(=\left(\frac{n+1}{2}\right)^{th}{2}\) observation.
\(={ \left( \frac {15+1 }{ 2 } \right) }^{ th }\) observation
= 8th observation = 52
(iii) Mode
Arranging the data in descending order, we have
98,96,62,60,54,52,52,52,48,46,42,41,40,39
Here, 52 occurs most frequently (3 times)
\(\therefore\) Mode = 52.
10.
Modified Table
[Minimum class-size = 1]
| Age (in years) | Number of children (frequency) | Width of the class | Length of the rectangle |
| 1-2 | 5 | 1 | \(\frac {5}{1}\times 1 = 5\) |
| 2-3 | 3 | 1 | \(\frac {3}{1}\times 1 = 3\) |
| 3-5 | 6 | 2 | \(\frac {6}{2}\times 1 = 3\) |
| Age (in years) | Number of children (frequency) | Width of the class | Length of the rectangle |
| 5-7 | 12 | 2 | \(\frac {12}{2}\times 1 = 6\) |
| 7-10 | 9 | 3 | \(\frac {9}{3}\times 1 = 3\) |
| 10-15 | 10 | 5 | \(\frac {10}{5}\times 1 = 2\) |
| 15-17 | 4 | 2 | \(\frac {4}{2}\times 1 = 2\) |
11.
Modified Tables
For Section A
| Marks | Class Marks | Freqeuncy |
| 0-10 | 5 | 3 |
| 10-20 | 15 | 9 |
| 20-30 | 25 | 17 |
| 30-40 | 35 | 12 |
| 40-50 | 45 | 9 |
For Section B
| Marks | Class Marks | Freqeuncy |
| 0-10 | 5 | 5 |
| 10-20 | 15 | 19 |
| 20-30 | 25 | 15 |
| 30-40 | 35 | 10 |
| 40-50 | 45 | 1 |
12.
Modified Continues Distribution
| Length (in mm) | Number of leaves |
| 117.5-126.5 | 3 |
| 126.5-135.5 | 5 |
| 135.5-144.5 | 9 |
| 144.5-153.5 | 12 |
| 153.5-162.5 | 5 |
| 162.5-171.5 | 4 |
| 171.5-180.5 | 2 |
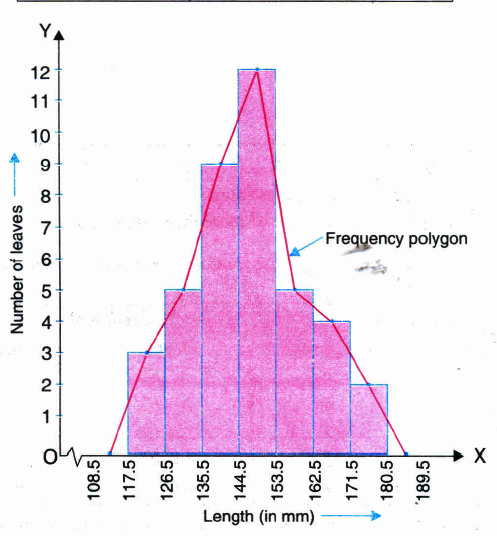
(ii) Frequency Polygon.
(iii) No, because the maximum number of leaves have their lengths lying in the original interval 145-153 (or modified interval 144.5-153.5).
13.
O is the most common and AB is the rarest blood group among these students.
14.
(i), (ii) and (iii) are primary data
(iv) and (v) are secondatary data.
15.
(i) Number of students
(ii) Number of fans un our school.
(iii) Electricity bills of our house for last two years.
(iv) Election results obtained from television or newspaper.
(v) Literacy rate figures obtained from Educational Survey.

9th Standard CBSE Syllabus & Materials
9th Standard CBSE
CBSE 9th Mathematics Lines and Angles Sample Question Papers Study Material - QB365 Set A
NEW9th Standard CBSE
CBSE 9th Mathematics Introduction to Euclid's Geometry Sample Question Papers Study Material - QB365 Set A
NEW9th Standard CBSE
CBSE 9th Mathematics Linear Equations in Two Variables Sample Question Papers Study Material - QB365 Set A
NEW9th Standard CBSE
CBSE 9th Mathematics Coordinate Geometry Sample Question Papers Study Material - QB365 Set A



CBSE 9th Standard CBSE Subjects
CBSE Standards