100% FREE ACCESS
9th Standard CBSE Syllabus & Materials
9th Standard CBSE
CBSE 9th Science Is matter around us pure? - New Model Questions Papers Study Material - QB365 Set A
NEW9th Standard CBSE
CBSE 9th Science Matter in our surroundings - New Model Questions Papers Study Material - QB365 Set A
NEW9th Standard CBSE
CBSE 9th Mathematics Heron's Formula Sample Question Papers Study Material - QB365 Set A
NEW9th Standard CBSE
CBSE 9th Mathematics Circles Sample Question Papers Study Material - QB365 Set A
NEW9th Standard CBSE
CBSE 9th Mathematics Quadrilaterals Sample Question Papers Study Material - QB365 Set A
NEW9th Standard CBSE
CBSE 9th Mathematics Triangles Sample Question Papers Study Material - QB365 Set A

Published on: 09/09/2022
QB365 provides a detailed and simple solution for every Possible Case Study Questions in Class 9th Maths Subject - Statistics, CBSE. It will help Students to get more practice questions, Students can Practice these question papers in addition to score best marks.
Download CBSE Class 9th Standard CBSE Mathematics question papers, sample papers, important questions, and previous year solved papers in PDF format. Get free study materials, NCERT solutions, and exam preparation resources for Class 9th Standard CBSE Mathematics
Questions + Answers key
Take MCQ Mathematics Test
1.
Anil is a Mathematics teacher in Hyderabad. After Periodic test 3, he asks students to collect the Mathematics marks of all the students of Class IX- A, B and C. A student is able to collect marks from some students. Rekha scored least mark 6 in the class and Ram scored highest marks 59 in the class. He prepares the frequency distribution table using the collected marks and draws Histogram using the table as shown in adjoining figure.
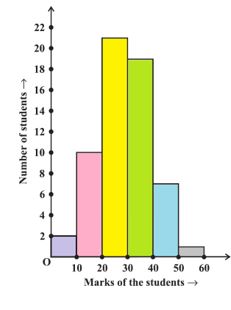
(a) What is the width of the class?
| (i) 10 | (ii) 15 | (iii) 5 | (iv) none of these |
(b) What is the total number of students in Histogram?
| (i) 50 | (ii) 60 | (iii) 65 | (iv) none of these |
(c) How many students scored 50% and above marks?
| (i) 19 | (ii) 26 | (iii) 27 | (iv) none of these |
(d) How many students scored less than 50% marks?
| (i) 19 | (ii) 26 | (iii) 27 | (iv) none of these |
(e) What is the range of the collected marks?
| (i) 60 | (ii) 59 | (iii) 53 | (iv) none of these |
2.
The COVID-19 pandemic, also known as the coronavirus pandemic, is an ongoing pandemic of coronavirus disease 2019 (COVID-19) caused by severe acute respiratory syndrome coronavirus 2 (SARS-CoV-2). It was first identified in December 2019 in Wuhan, China.
During survey, the ages of 80 patients infected by COVID and admitted in the one of the City hospital were recorded and the collected data is represneted in the less than cumulative frequency distribution table.

Based on the information, answer the following questions:
| Age (in yrs) | No. of patients |
| 5 - 15 | 6 |
| 15 - 25 | 11 |
| 25 - 35 | 21 |
| 35 - 45 | 23 |
| 45 - 55 | 14 |
| 55 - 65 | 5 |
(a) The class interval with highest frequency is:
| (i) 45-55 | (ii) 35-45 | (iii) 25-35 | (iv) 15-25 |
(b) Which age group was affected the least?
| (i) 35-45 | (ii) 25-35 |
| (iii) 55-65 | (iv) 45-55 |
(c) Which are group was affected the most?
| (i) 35-45 | (ii) 25-35 |
| (iii) 15-25 | (iv) 45-55 |
(d) How many patients of the age 45 years and above were admitted?
| (i) 61 | (ii) 19 | (iii) 14 | (iv) 23 |
(e) How many patients of the age 35 years and less were admitted?
| (i) 17 | (ii) 38 | (iii) 61 | (iv) 41 |
3.
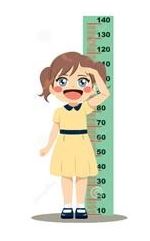
A group of students decided to make a project on Statistics. They are collecting the heights (in cm) of their 51 girls of Class IX-A, B and C of their school. After collecting the data, they arranged the data in the following frequency distribution table form:
| Height (in cm) | Number of girls |
| 135 - 140 | 4 |
| 140 - 145 | 7 |
| 145 - 150 | 18 |
| 150 - 155 | 11 |
| 155 - 160 | 6 |
| 160 - 165 | 5 |
Based on the information, answer the following questions:
(a) The class interval with highest frequency is :
| (i) 145-150 | (ii) 150 -155 |
| (iii) 140-145 | (iv) 155-160 |
(b) What is the width of the class?
| (i) 10 | (ii) 15 | (iii) 5 | (iv) none of these |
(c) How many students of the height 150 cm and below are there?
| (i) 40 | (ii) 29 |
| (iii) 18 | (iv) 22 |
(d) How many students of the height 145 cm and above are there?
| (i) 40 | (ii) 29 | (iii) 18 | (iv) 22 |
(e) How many students of the height more than 145 cm but less than 155 are there?
| (i) 40 | (ii) 29 |
| (iii) 18 | (iv) 22 |
4.
A Mathematics teacher asks students to collect the marks of Mathematics in Half yearly exam. She instructed to all the students to prepare frequency disctribution table using the data collected. Ram collected the following marks (out of 50) obtained in Mathematics by 60 students of Class IX
21, 10, 30, 22, 33, 5, 37, 12, 25, 42, 15, 39, 26, 32, 18, 27, 28, 19, 29, 35, 31, 24, 36, 18, 20, 38, 22, 44, 16, 24, 10, 27, 39, 28, 49, 29, 32, 23, 31, 21, 34, 22, 23, 36, 24, 36, 33, 47, 48, 50, 39, 20, 7, 16, 36, 45, 47, 30, 22, 17.

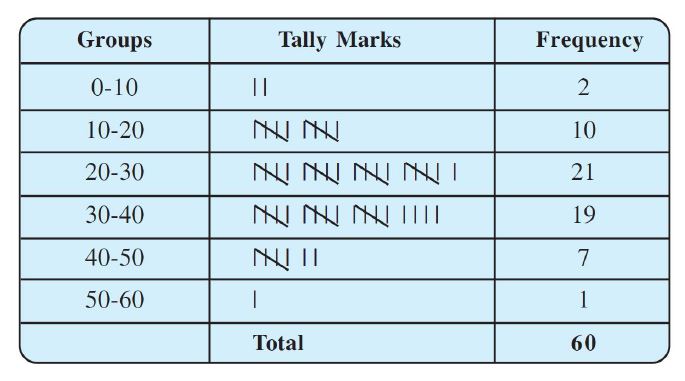
(i) How many students scored more than 20 but less than 30?
| (a) 20 | (b) 21 |
| (c) 22 | (d) 23 |
(ii) How many students scored less than 20 marks?
| (a) 10 | (b) 11 |
| (c) 12 | (d) 14 |
(iii) How many students scored more than 60% marks?
| (a) 20 | (b) 25 |
| (c) 26 | (d) 27 |
(iv) What is the class size of the classes?
| (a) 10 | (b) 5 |
| (c) 15 | (d) 20 |
(v) What is the class mark of the class interval 30 – 40?
| (a) 30 | (b) 35 |
| (c) 40 | (d) 70 |
5.
The Class teacher of Class X preparing result analysis of a student. She compares the marks of a student obtained in Class IX (2018-19) and Class X (2019-20) using the double bar graph as shown below:
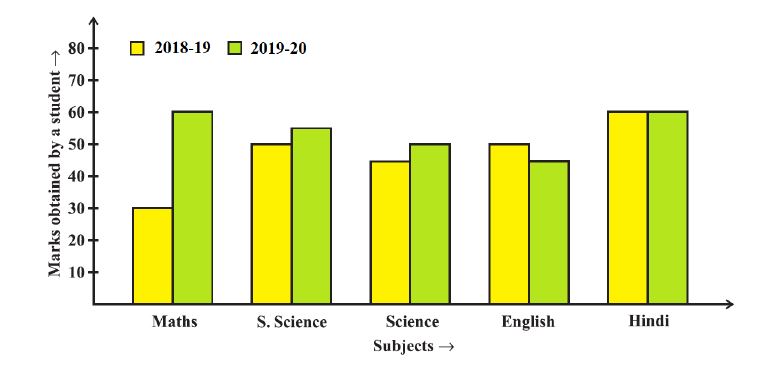
(i) In which subject has the performance improved the most?
| (a) Maths | (b) Social Science |
| (c) Science | (d) English |
(ii) In which subject has the performance deteriorated?
| (a) Maths | (b) Social Science |
| (c) Science | (d) English |
(iii) In which subject is the performance at par?
| (a) Hindi | (b) Maths |
| (c) Science | (d) English |
(iv) What is the difference in Maths Subject?
| (a) 5 | (b) 30 |
| (c) 0 | (d) 10 |
(v) What is the percentage of marks obtained by a student in Class X (2019-20)?
| (a) 60% | (b) 55% |
| (c) 54% | (d) 65% |
1.
(a) (i) 10
(b) (ii) 60
(c) (iii) 27
50% marks of 60 = 50 x 60/100 = 30 marks
Total number of students scored more than 30 marks
= 19 + 7 +1
= 27
(d) (iv) none of these
(e) (iii) 53
2.
(a) (ii) 35-45
Highest frequency is 23
Which belongs to 35-45.
(b) (i) 35-45
(c) (i) 35-45
(d) (ii) 19
(e) (ii) 38
3.
(a) (i) 145-150
Highest frequency is 18 which belongs to 145 – 150.
(b) (iii) 5
(c) (ii) 29
(d) (i) 40
(e) (ii) 29
4.
(i) (b) 21
(ii) (c) 12
(iii) (d) 27
60% marks = 30 marks
No. of students more than 30 marks = 19 + 7 + 1 = 27
(iv) (a) 10
(v) (b) 35
Class mark = Mean of lower limit and upper limit
= (30 + 40) / 2
= 70/2 = 35
5.
(i) (a) Maths
(ii) (d) English
(iii) (a) Hindi
(iv) (b) 30
Difference = 60 – 30 = 30
(v) (c) 54%
Total marks = 60 + 55 + 50 + 45 + 60
= 270
Percentage = 270 x 100/500 = 54%

9th Standard CBSE Syllabus & Materials
9th Standard CBSE
CBSE 9th Mathematics Lines and Angles Sample Question Papers Study Material - QB365 Set A
NEW9th Standard CBSE
CBSE 9th Mathematics Introduction to Euclid's Geometry Sample Question Papers Study Material - QB365 Set A
NEW9th Standard CBSE
CBSE 9th Mathematics Linear Equations in Two Variables Sample Question Papers Study Material - QB365 Set A
NEW9th Standard CBSE
CBSE 9th Mathematics Coordinate Geometry Sample Question Papers Study Material - QB365 Set A



CBSE 9th Standard CBSE Subjects
CBSE Standards