- State Board
-
12th Standard
-

Biology
-

Computer Applications
-

Computer Science
-

Business Maths and Statistics
-

Commerce
-

Economics
-

Maths
-

Chemistry
-

Physics
-
Computer Technology
-

History
-

Accountancy
-

Tamil
-
Maths
-
Chemistry
-

Physics
-

Biology
-
Computer Science
-

Business Maths and Statistics
-
Economics
-
Commerce
-
Accountancy
-
History
-
Computer Applications
-
Computer Technology
-

English
12th Standard stateboard question papers & Study material
தமிழ் Subjects
English Subjects
-
-
11th Standard
-
Maths
-
Biology
-

உயிரியல் - தாவரவியல்
-
Economics
-
Physics
-
Chemistry
-
History
-

Business Maths and Statistics
-

Computer Science
-
Accountancy
-
Commerce
-
Computer Applications
-
Computer Technology
-
Tamil
-
Maths
-
Commerce
-
Economics
-
Biology
-
Business Maths and Statistics
-
Accountancy
-
Computer Science
-
Physics
-
Chemistry
-
Computer Applications
-
History
-
Computer Technology
-
Tamil
-
English
11th Standard stateboard question papers & Study material
தமிழ் Subjects
English Subjects
-
-
9th Standard
-
-

-

-
-
-
-
Maths
-
Science
-
Social Science
-
Maths
-
Science
-
Social Science
9th Standard stateboard question papers & Study material
தமிழ் Subjects
English Subjects
-
-
6th Standard
-
Maths
-
Science
-
Social Science
-
Maths
-
Science
-
Social Science
6th Standard stateboard question papers & Study material
தமிழ் Subjects
English Subjects
-
-
10th Standard
-
Maths
-
Science
-
Social Science
-
Tamil
-
Maths
-
Science
-
Social Science
-
English
-
English
10th Standard stateboard question papers & Study material
தமிழ் Subjects
English Subjects
-
-
7th Standard
-
Maths
-
Science
-
Maths
-
Science
-
Social Science
7th Standard stateboard question papers & Study material
தமிழ் Subjects
English Subjects
-
-
8th Standard
-
கணிதம் - old
-
Science
-
Social Science
-
கணிதம்
-
Maths
-
Science
-
Social Science
8th Standard stateboard question papers & Study material
தமிழ் Subjects
English Subjects
-
-
12th Standard
- CBSE Board
-
12th Standard CBSE
-

Biology
-

Chemistry
-

Physics
-

Maths
-

Accountancy
-

Business Studies
-

Economics
-

Introductory Micro and Macroeconomics
-

Computer Science
-

Geography
-

English
-

History
-

Indian Society
-

Physical Education
-

Sociology
-

Political Science
-

Engineering Graphics
-

Bio Technology
-

Entrepreneurship
-

Hindi Elective
-

Home Science
-

Legal Studies
-

Psychology
-
Hindi Core
-

Tamil
12th Standard CBSE Subject Question Paper & Study Material
-
-
11th Standard CBSE
-
Physics
-
Mathematics
-
Chemistry
-
Biology
-
Economics
-
Business Studies
-
Accountancy
-
Computer Science
-
English
-
Geography
-
History
-
Physical Education
-
Psychology
-
Sociology
-
Bio Technology
-
Enterprenership
-
Hindi
-
Home Science
-
Political Science
-

Applied Mathematics
11th Standard CBSE Subject Question Paper & Study Material
-
- 10th Standard CBSE
-
9th Standard CBSE
-

Social Science
-
Mathematics
-

Science
-
English
-
Hindi
9th Standard CBSE Subject Question Paper & Study Material
-
-
8th Standard CBSE
-

Social Science
-
Science
-
Mathematics
-
English
8th Standard CBSE Subject Question Paper & Study Material
-
-
7th Standard CBSE
-
Social Science
-
Science
-
Mathematics
-
English
7th Standard CBSE Subject Question Paper & Study Material
-
-
6th Standard CBSE
-
Social Science
-
Science
-
Mathematics
-
English
6th Standard CBSE Subject Question Paper & Study Material
-
-
12th Standard CBSE
- Free Online Test
- News
- Study Materials
-
Students
-

Stateboard Tamil Nadu
-

CBSE Board
-

Free Online Tests
-

Educational News
-

Scholarships
-

Entrance Exams India
-

Video Materials
Study Materials , News and Scholarships
-
-
Students


12th Computer Science - Data Visualization Using Pyplot: Line Chart, Pie Chart and Bar Chart Three and Five Marks Questions Question Bank Software Oct-14 , 2019
Data Visualization Using Pyplot: Line Chart, Pie Chart and Bar Chart
Data Visualization Using Pyplot: Line Chart, Pie Chart and Bar Chart Three and Five Marks Questions
12th Standard
-
Reg.No. :
Computer Science
Time :
00:45:00 Hrs
Total Marks :
40
-
Draw the output for the following data visualization plot.
import matplotlib.pyplot as plt
plt.bar([1,3,5,7,9],[5,2,7,8,2], label="Example one")
plt.bar([2,4,6,8,10],[8,6,2,5,6], label="Example two", color='g')
plt.legend()
plt.xlabel('bar number')
plt.ylabel('bar height')
plt.title('Epic Graph in Another Line! Whoa')
plt.show() -
Write any three uses of data visualization.
-
Write the coding for the following:
a. To check if PIP is Installed in your PC.
b. To Check the version of PIP installed in your PC.
c. To list the packages in matplotlib. -
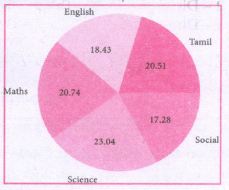
Write the plot for the following pie chart output.
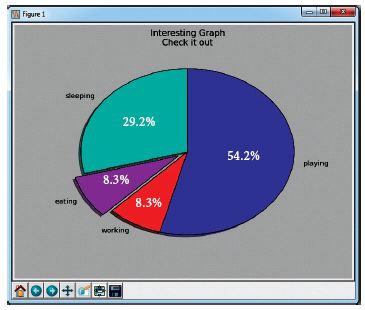
-
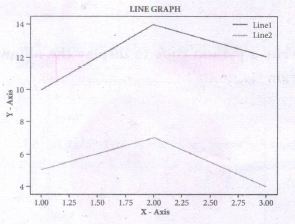
Write a python code to display the following plot.
-
Explain in detail the types of pyplots using Matplotlib.
-
Explain the purpose of the following functions:
a. plt.xlabel
b. plt.ylabel
c. plt.title
d. plt.legend()
e. plt.show() -
Write a python code to display the following, plot.
-
Write the key differences between Histogram and bar graph.
-
Write s python code to display to following plot.
Program
5 x 3 = 15
5 x 5 = 25
 12th Standard Computer Science Syllabus
  12th Standard Computer Science Study Materials
 12th Standard Computer Science MCQ Practise Tests

Reviews & Comments about 12th Computer Science - Data Visualization Using Pyplot: Line Chart, Pie Chart and Bar Chart Three and Five Marks Questions
Write your Comment