- State Board
-
12th Standard
-

Biology
-

Computer Applications
-

Computer Science
-

Business Maths and Statistics
-

Commerce
-

Economics
-

Maths
-

Chemistry
-

Physics
-
Computer Technology
-

History
-

Accountancy
-

Tamil
-
Maths
-
Chemistry
-

Physics
-

Biology
-
Computer Science
-

Business Maths and Statistics
-
Economics
-
Commerce
-
Accountancy
-
History
-
Computer Applications
-
Computer Technology
-

English
12th Standard stateboard question papers & Study material
தமிழ் Subjects
English Subjects
-
-
11th Standard
-
Maths
-
Biology
-

உயிரியல் - தாவரவியல்
-
Economics
-
Physics
-
Chemistry
-
History
-

Business Maths and Statistics
-

Computer Science
-
Accountancy
-
Commerce
-
Computer Applications
-
Computer Technology
-
Tamil
-
Maths
-
Commerce
-
Economics
-
Biology
-
Business Maths and Statistics
-
Accountancy
-
Computer Science
-
Physics
-
Chemistry
-
Computer Applications
-
History
-
Computer Technology
-
Tamil
-
English
11th Standard stateboard question papers & Study material
தமிழ் Subjects
English Subjects
-
-
9th Standard
-
-

-

-
-
-
-
Maths
-
Science
-
Social Science
-
Maths
-
Science
-
Social Science
9th Standard stateboard question papers & Study material
தமிழ் Subjects
English Subjects
-
-
6th Standard
-
Maths
-
Science
-
Social Science
-
Maths
-
Science
-
Social Science
6th Standard stateboard question papers & Study material
தமிழ் Subjects
English Subjects
-
-
10th Standard
-
Maths
-
Science
-
Social Science
-
Tamil
-
Maths
-
Science
-
Social Science
-
English
-
English
10th Standard stateboard question papers & Study material
தமிழ் Subjects
English Subjects
-
-
7th Standard
-
Maths
-
Science
-
Maths
-
Science
-
Social Science
7th Standard stateboard question papers & Study material
தமிழ் Subjects
English Subjects
-
-
8th Standard
-
கணிதம் - old
-
Science
-
Social Science
-
கணிதம்
-
Maths
-
Science
-
Social Science
8th Standard stateboard question papers & Study material
தமிழ் Subjects
English Subjects
-
-
12th Standard
- CBSE Board
-
12th Standard CBSE
-

Biology
-

Chemistry
-

Physics
-

Maths
-

Accountancy
-

Business Studies
-

Economics
-

Introductory Micro and Macroeconomics
-

Computer Science
-

Geography
-

English
-

History
-

Indian Society
-

Physical Education
-

Sociology
-

Political Science
-

Engineering Graphics
-

Bio Technology
-

Entrepreneurship
-

Hindi Elective
-

Home Science
-

Legal Studies
-

Psychology
-
Hindi Core
-

Tamil
12th Standard CBSE Subject Question Paper & Study Material
-
-
11th Standard CBSE
-
Physics
-
Mathematics
-
Chemistry
-
Biology
-
Economics
-
Business Studies
-
Accountancy
-
Computer Science
-
English
-
Geography
-
History
-
Physical Education
-
Psychology
-
Sociology
-
Bio Technology
-
Enterprenership
-
Hindi
-
Home Science
-
Political Science
-

Applied Mathematics
11th Standard CBSE Subject Question Paper & Study Material
-
- 10th Standard CBSE
-
9th Standard CBSE
-

Social Science
-
Mathematics
-

Science
-
English
-
Hindi
9th Standard CBSE Subject Question Paper & Study Material
-
-
8th Standard CBSE
-

Social Science
-
Science
-
Mathematics
-
English
8th Standard CBSE Subject Question Paper & Study Material
-
-
7th Standard CBSE
-
Social Science
-
Science
-
Mathematics
-
English
7th Standard CBSE Subject Question Paper & Study Material
-
-
6th Standard CBSE
-
Social Science
-
Science
-
Mathematics
-
English
6th Standard CBSE Subject Question Paper & Study Material
-
-
12th Standard CBSE
- Free Online Test
- News
- Study Materials
-
Students
-

Stateboard Tamil Nadu
-

CBSE Board
-

Free Online Tests
-

Educational News
-

Scholarships
-

Entrance Exams India
-

Video Materials
Study Materials , News and Scholarships
-
-
Students


12th Standard Computer Science Data Visualization Using Pyplot English Medium Free Online Test One Mark Questions with Answer Key 2020 - 2021 Question Bank Software Nov-05 , 2020
12th Standard Computer Science Data Visualization Using Pyplot English Medium Free Online Test One Mark Questions with Answer Key 2020 - 2021
12th Standard Computer Science Data Visualization Using Pyplot English Medium Free Online Test One Mark Questions with Answer Key 2020 - 2021
12th Standard
-
Reg.No. :
Computer Science
Time :
00:10:00 Hrs
Total Marks :
10
-
Identify the package manager for Python packages, or modules.
(a)Matplotlib
(b)PIP
(c)plt.show()
(d)python package
-
Observe the output figure. Identify the coding for obtaining this output.
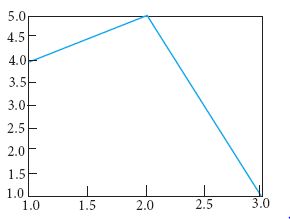 (a)
(a)import matplotlib.pyplot as plt
plt.plot([1,2,3],[4,5,1])
plt.show()(b)import matplotlib.pyplot as plt
plt.plot([1,2],[4,5])
plt.show()(c)import matplotlib.pyplot as plt
plt.plot([2,3],[5,1])
plt.show()(d)import matplotlib.pyplot as plt
plt.plot([1,3],[4,1])
plt.show() -
Which key is used to run the module?
(a)F6
(b)F4
(c)F3
(d)F5
-
The numerical data is encoded using
(a)dots
(b)lines
(c)bars
(d)all of these
-
Which type of charts displays information as series of data points?
(a)Bar
(b)Pie
(c)Line
(d)Histogram
-
Which type of chart shows the relationship between a numerical variable and categorical variable?
(a)line
(b)bar
(c)pie
(d)x-y plot
-
Which of the following plot we cannot rearrange the blocks from highest to lowest?
(a)Line
(b)Bar chart
(c)Pie chart
(d)Histogram
-
In which plot the width of the bars mayor may not be same?
(a)Histogram
(b)Pie chat
(c)Bar chat
(d)Line
-
Which parameter used to display ( ) the percentage value using Python string formatting in pie chart?
(a)percent
(b)autopct
(c)pet
(d)percentage
-
________ and ______ are the two ways to display data in the form of diagram.
(a)Line chart, Pie chart
(b)Line chart, Bar chart
(c)Bar Graph, Histogram
(d)Line chart, Histogram
Answer all the questions
10 x 1 = 10
*****************************************
Answers
-
(b)
PIP
-
(a)
import matplotlib.pyplot as plt plt.plot([1,2,3],[4,5,1]) plt.show()
-
(d)
F5
-
(d)
all of these
-
(c)
Line
-
(b)
bar
-
(d)
Histogram
-
(a)
Histogram
-
(b)
autopct
-
(c)
Bar Graph, Histogram
 12th Standard Computer Science Syllabus
  12th Standard Computer Science Study Materials
 12th Standard Computer Science MCQ Practise Tests

Reviews & Comments about 12th Standard Computer Science Data Visualization Using Pyplot English Medium Free Online Test One Mark Questions with Answer Key 2020 - 2021
Write your Comment