- State Board
-
12th Standard
-

Biology
-

Computer Applications
-

Computer Science
-

Business Maths and Statistics
-

Commerce
-

Economics
-

Maths
-

Chemistry
-

Physics
-
Computer Technology
-

History
-

Accountancy
-

Tamil
-
Maths
-
Chemistry
-

Physics
-

Biology
-
Computer Science
-

Business Maths and Statistics
-
Economics
-
Commerce
-
Accountancy
-
History
-
Computer Applications
-
Computer Technology
-

English
12th Standard stateboard question papers & Study material
தமிழ் Subjects
English Subjects
-
-
11th Standard
-
Maths
-
Biology
-

உயிரியல் - தாவரவியல்
-
Economics
-
Physics
-
Chemistry
-
History
-

Business Maths and Statistics
-

Computer Science
-
Accountancy
-
Commerce
-
Computer Applications
-
Computer Technology
-
Tamil
-
Maths
-
Commerce
-
Economics
-
Biology
-
Business Maths and Statistics
-
Accountancy
-
Computer Science
-
Physics
-
Chemistry
-
Computer Applications
-
History
-
Computer Technology
-
Tamil
-
English
11th Standard stateboard question papers & Study material
தமிழ் Subjects
English Subjects
-
-
9th Standard
-
-

-

-
-
-
-
Maths
-
Science
-
Social Science
-
Maths
-
Science
-
Social Science
9th Standard stateboard question papers & Study material
தமிழ் Subjects
English Subjects
-
-
6th Standard
-
Maths
-
Science
-
Social Science
-
Maths
-
Science
-
Social Science
6th Standard stateboard question papers & Study material
தமிழ் Subjects
English Subjects
-
-
10th Standard
-
Maths
-
Science
-
Social Science
-
Tamil
-
Maths
-
Science
-
Social Science
-
English
-
English
10th Standard stateboard question papers & Study material
தமிழ் Subjects
English Subjects
-
-
7th Standard
-
Maths
-
Science
-
Maths
-
Science
-
Social Science
7th Standard stateboard question papers & Study material
தமிழ் Subjects
English Subjects
-
-
8th Standard
-
கணிதம் - old
-
Science
-
Social Science
-
கணிதம்
-
Maths
-
Science
-
Social Science
8th Standard stateboard question papers & Study material
தமிழ் Subjects
English Subjects
-
-
12th Standard
- CBSE Board
-
12th Standard CBSE
-

Biology
-

Physics
-

Chemistry
-

Maths
-

Accountancy
-

Introductory Micro and Macroeconomics
-

Business Studies
-

Economics
-

Computer Science
-

Geography
-

English
-

History
-

Indian Society
-

Physical Education
-

Sociology
-

Tamil
-

Bio Technology
-

Engineering Graphics
-

Entrepreneurship
-

Hindi Core
-
Hindi Elective
-

Home Science
-

Legal Studies
-

Political Science
-

Psychology
12th Standard CBSE Subject Question Paper & Study Material
-
-
11th Standard CBSE
-
Mathematics
-
Chemistry
-
Biology
-
Physics
-
Business Studies
-
Accountancy
-
Economics
-
Computer Science
-
Bio Technology
-
English
-
Enterprenership
-
Geography
-
Hindi
-
History
-
Home Science
-
Physical Education
-
Political Science
-
Psychology
-
Sociology
-

Applied Mathematics
11th Standard CBSE Subject Question Paper & Study Material
-
- 10th Standard CBSE
-
9th Standard CBSE
-
Mathematics
-

Social Science
-

Science
-
English
-
Hindi
9th Standard CBSE Subject Question Paper & Study Material
-
-
8th Standard CBSE
-
Science
-

Social Science
-
Mathematics
-
English
8th Standard CBSE Subject Question Paper & Study Material
-
-
7th Standard CBSE
-
Mathematics
-
Science
-
Social Science
-
English
7th Standard CBSE Subject Question Paper & Study Material
-
-
6th Standard CBSE
-
Mathematics
-
Science
-
Social Science
-
English
6th Standard CBSE Subject Question Paper & Study Material
-
-
12th Standard CBSE
- Free Online Test
- News
- Study Materials
-
Students
-

Stateboard Tamil Nadu
-

CBSE Board
-

Free Online Tests
-

Educational News
-

Scholarships
-

Entrance Exams India
-

Video Materials
Study Materials , News and Scholarships
-
-
Students


12th Standard Computer Science English Medium Data Visualization Using Pyplot Reduced Syllabus Important Questions With Answer Key 2021 Question Bank Software Feb-03 , 2021
12th Standard Computer Science English Medium Data Visualization Using Pyplot Reduced Syllabus Important Questions With Answer Key 2021
12th Standard Computer Science English Medium Data Visualization Using Pyplot Reduced Syllabus Important Questions With Answer Key 2021
12th Standard
-
Reg.No. :
Computer Science
Time :
01:00:00 Hrs
Total Marks :
100
-
Which is a python package used for 2D graphics?
(a)matplotlib.pyplot
(b)matplotlib.pip
(c)matplotlib.numpy
(d)matplotlib.plt
-
Identify the package manager for Python packages, or modules.
(a)Matplotlib
(b)PIP
(c)plt.show()
(d)python package
-
To install matplotlib, the following function will be typed in your command prompt. What does “-U”represents?
Python –m pip install –U pip(a)downloading pip to the latest version
(b)upgrading pip to the latest version
(c)removing pip
(d)upgrading matplotlib to the latest version
-
Read the code:
a. import matplotlib.pyplot as plt
b. plt.plot(3,2)
c. plt.show()
Identify the output for the above coding(a) (b)
(b) (c)
(c) (d)
(d)
-
Which key is used to run the module?
(a)F6
(b)F4
(c)F3
(d)F5
-
Identify the right type of chart using the following hints.
Hint 1: This chart is often used to visualize a trend in data over intervals of time.
Hint 2: The line in this type of chart is often drawn chronologically.(a)Line chart
(b)Bar chart
(c)Pie chart
(d)Scatter plot
-
Read the statements given below. Identify the right option from the following for pie chart.
Statement A: To make a pie chart with Matplotlib, we can use the plt.pie() function.
Statement B: The autopct parameter allows us to display the percentage value using the Python string formatting.(a)Statement A is correct
(b)Statement B is correct
(c)Both the statements are correct
(d)Both the statements are wrong
-
Which kind of data encoded visually communicate a quantitative message
(a)String
(b)Numbers
(c)Images
(d)None of these
-
Which of the following is the representation of information in a graphic format?
(a)Info graphics
(b)Graphics
(c)Dashboard
(d)Charts
-
Which of the following is a collection of resources assembled to create a single unified visual display?
(a)Info graphics
(b)Dashboard
(c)Graphics
(d)Chats
-
The most popular data visualization library in Python is
(a)matplotlib
(b)pip
(c)matinfolib
(d)matpiplib
-
In Python matplotlib is a
(a)control structure
(b)dictionary
(c)library
(d)list
-
Matplotlib allows you to create a
(a)Table
(b)Charts
(c)Maps
(d)Info graphics
-
The default x.vector has the same length of y but starts with
(a)3
(b)2
(c)1
(d)0
-
The different kinds of plot created using
(a)Matplotlib
(b)Matplot
(c)Plotlib
(d)Matliplot
-
Which of the following chart represents the frequency distribution of continuous variables?
(a)Histogram
(b)Pie
(c)Line
(d)Bar
-
Which plot is a circular graphical representation of numerical data?
(a)Histogram
(b)xy plot
(c)Bar plot
(d)Pie chart
-
Which parameter used to display ( ) the percentage value using Python string formatting in pie chart?
(a)percent
(b)autopct
(c)pet
(d)percentage
-
Data visualization used ________ graphics.
(a)2D
(b)3D
(c)Statistical
(d)Image
-
In Scatter plot, the position of a point depends on its________ value
(a)2 - Dimensional
(b)3 - Dimensional
(c)1 - Dimensional
(d)7 - Dimensional
-
If a list given to the plot ( ) command, matplotlib assumes it is a sequence of _____ values
(a)X
(b)Y
(c)0
(d)4
-
Zoom in will require ______ and drag.
(a)click
(b)left click
(c)double click
(d)right click
-
Zoom out will require ________ and drag.
(a)click
(b)left click
(c)double click
(d)right click
-
________ and ______ are the two ways to display data in the form of diagram.
(a)Line chart, Pie chart
(b)Line chart, Bar chart
(c)Bar Graph, Histogram
(d)Line chart, Histogram
-
What is Data Visualization?
-
List the general types of data visualization.
-
List the types of Visualizations in Matplotlib.
-
How will you install Matplotlib?
-
Write the difference between the following functions: plt.plot([1,2,3,4]), plt.plot([1,2,3,4], [1,4,9,16]).
-
What is Infographics data visualization?
-
What is matplotlib?
-
Define scatter plot.
-
Write note or Box plot.
-
What is pip?
-
What are the two ways to display data in the form of diagram?
-
Draw the output for the following data visualization plot.
import matplotlib.pyplot as plt
plt.bar([1,3,5,7,9],[5,2,7,8,2], label="Example one")
plt.bar([2,4,6,8,10],[8,6,2,5,6], label="Example two", color='g')
plt.legend()
plt.xlabel('bar number')
plt.ylabel('bar height')
plt.title('Epic Graph in Another Line! Whoa')
plt.show() -
Write any three uses of data visualization.
-
Write the coding for the following:
a. To check if PIP is Installed in your PC.
b. To Check the version of PIP installed in your PC.
c. To list the packages in matplotlib. -
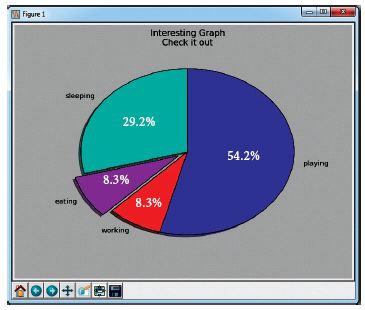
Write the plot for the following pie chart output.
-
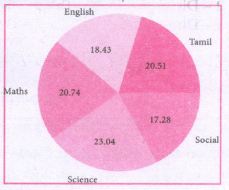
Write a python code to display the following plot.
-
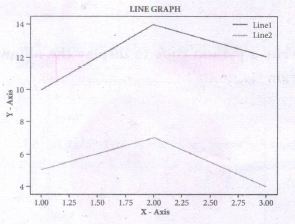
Write a python code to display the following plot.
-
List the buttons in matlibplot window.
-
Read the following code. What does the following represents.
(i) Labels
(ii) Usage
(iii) X ticks
(iv) Range
(v) Show -
Explain in detail the types of pyplots using Matplotlib.
-
Explain the various buttons in a matplotlib window.
-
Explain the purpose of the following functions:
a. plt.xlabel
b. plt.ylabel
c. plt.title
d. plt.legend()
e. plt.show() -
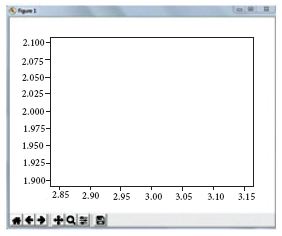
Write a python code to display the following, plot.
-
Write the key differences between Histogram and bar graph.
-
Write s python code to display to following plot.
Program
Multiple Choice Questions
24 x 1 = 24
2 Marks
11 x 2 = 22
3 Marks
8 x 3 = 24
5 Marks
6 x 5 = 30
*****************************************
Answers
-
(a)
matplotlib.pyplot
-
(b)
PIP
-
(b)
upgrading pip to the latest version
-
(c)
-
(d)
F5
-
(a)
Line chart
-
(c)
Both the statements are correct
-
(b)
Numbers
-
(a)
Info graphics
-
(b)
Dashboard
-
(d)
matpiplib
-
(c)
library
-
(b)
Charts
-
(d)
0
-
(a)
Matplotlib
-
(a)
Histogram
-
(d)
Pie chart
-
(b)
autopct
-
(c)
Statistical
-
(a)
2 - Dimensional
-
(b)
Y
-
(b)
left click
-
(d)
right click
-
(c)
Bar Graph, Histogram
 12th Standard Computer Science Syllabus
  12th Standard Computer Science Study Materials
 12th Standard Computer Science MCQ Practise Tests

Reviews & Comments about 12th Standard Computer Science English Medium Data Visualization Using Pyplot Reduced Syllabus Important Questions With Answer Key 2021
Write your Comment