- State Board
-
12th Standard
-

Biology
-

Computer Applications
-

Computer Science
-

Business Maths and Statistics
-

Commerce
-

Economics
-

Maths
-

Chemistry
-

Physics
-
Computer Technology
-

History
-

Accountancy
-

Tamil
-
Maths
-
Chemistry
-

Physics
-

Biology
-
Computer Science
-

Business Maths and Statistics
-
Economics
-
Commerce
-
Accountancy
-
History
-
Computer Applications
-
Computer Technology
-

English
12th Standard stateboard question papers & Study material
தமிழ் Subjects
English Subjects
-
-
11th Standard
-
Maths
-
Biology
-

உயிரியல் - தாவரவியல்
-
Economics
-
Physics
-
Chemistry
-
History
-

Business Maths and Statistics
-

Computer Science
-
Accountancy
-
Commerce
-
Computer Applications
-
Computer Technology
-
Tamil
-
Maths
-
Commerce
-
Economics
-
Biology
-
Business Maths and Statistics
-
Accountancy
-
Computer Science
-
Physics
-
Chemistry
-
Computer Applications
-
History
-
Computer Technology
-
Tamil
-
English
11th Standard stateboard question papers & Study material
தமிழ் Subjects
English Subjects
-
-
9th Standard
-
-

-

-
-
-
-
Maths
-
Science
-
Social Science
-
Maths
-
Science
-
Social Science
9th Standard stateboard question papers & Study material
தமிழ் Subjects
English Subjects
-
-
6th Standard
-
Maths
-
Science
-
Social Science
-
Maths
-
Science
-
Social Science
6th Standard stateboard question papers & Study material
தமிழ் Subjects
English Subjects
-
-
10th Standard
-
Maths
-
Science
-
Social Science
-
Tamil
-
Maths
-
Science
-
Social Science
-
English
-
English
10th Standard stateboard question papers & Study material
தமிழ் Subjects
English Subjects
-
-
7th Standard
-
Maths
-
Science
-
Maths
-
Science
-
Social Science
7th Standard stateboard question papers & Study material
தமிழ் Subjects
English Subjects
-
-
8th Standard
-
கணிதம் - old
-
Science
-
Social Science
-
கணிதம்
-
Maths
-
Science
-
Social Science
8th Standard stateboard question papers & Study material
தமிழ் Subjects
English Subjects
-
-
12th Standard
- CBSE Board
-
12th Standard CBSE
-

Biology
-

Physics
-

Chemistry
-

Maths
-

Accountancy
-

Introductory Micro and Macroeconomics
-

Business Studies
-

Economics
-

Computer Science
-

Geography
-

English
-

History
-

Indian Society
-

Physical Education
-

Sociology
-

Tamil
-

Bio Technology
-

Engineering Graphics
-

Entrepreneurship
-

Hindi Core
-
Hindi Elective
-

Home Science
-

Legal Studies
-

Political Science
-

Psychology
12th Standard CBSE Subject Question Paper & Study Material
-
-
11th Standard CBSE
-
Mathematics
-
Chemistry
-
Biology
-
Physics
-
Business Studies
-
Accountancy
-
Economics
-
Computer Science
-
Bio Technology
-
English
-
Enterprenership
-
Geography
-
Hindi
-
History
-
Home Science
-
Physical Education
-
Political Science
-
Psychology
-
Sociology
-

Applied Mathematics
11th Standard CBSE Subject Question Paper & Study Material
-
- 10th Standard CBSE
-
9th Standard CBSE
-
Mathematics
-

Social Science
-

Science
-
English
-
Hindi
9th Standard CBSE Subject Question Paper & Study Material
-
-
8th Standard CBSE
-
Science
-

Social Science
-
Mathematics
-
English
8th Standard CBSE Subject Question Paper & Study Material
-
-
7th Standard CBSE
-
Mathematics
-
Science
-
Social Science
-
English
7th Standard CBSE Subject Question Paper & Study Material
-
-
6th Standard CBSE
-
Mathematics
-
Science
-
Social Science
-
English
6th Standard CBSE Subject Question Paper & Study Material
-
-
12th Standard CBSE
- Free Online Test
- News
- Study Materials
-
Students
-

Stateboard Tamil Nadu
-

CBSE Board
-

Free Online Tests
-

Educational News
-

Scholarships
-

Entrance Exams India
-

Video Materials
Study Materials , News and Scholarships
-
-
Students


8th Standard English Medium Maths Subject Term 3 Statistics Book Back 2 Mark Questions with Solution Part - I Jun-15 , 2021
QB365 provides detailed and simple solution for every book back questions in class 8 Maths subject.It will helps to get more idea about question pattern in every book back questions with solution.
8th Standard English Medium Maths Subject Term 3 Statistics Book Back 2 Mark Questions with Solution Part - I
8th Standard
-
Reg.No. :
Maths
Time :
01:00:00 Hrs
Total Marks :
10
-
The continuous series of
10 -20 24-34 38-48 52-62 -
Income from various sources for Government of India from a rupee is given below. Draw a pie chart.
Source Corporation tax Income tax Customs Excise duties Service Tax Others Income (in paise) 19 16 9 14 10 32 -
Monthly expenditure of Kumaran’s family is given below. Draw a suitable Pie chart.
Particulars Food Education Rent Transport Miscellaneous Expenses (in %) 50 % 20 % 15 % 5 % 10 % Also
1. Find the amount spent for education if Kumaran spends Rs.6000 for Rent.
2. What is the total salary of Kumaran?
3. How much did he spend more for food than education -
Which of the following data can be represented in a histogram?
(i) The number of mountain climbers in the age group 20 to 60.
(ii) Production of cycles in different years.
(iii) The number of students in each class of a school.
(iv) The number votes polled from 7 am to 6 pm in an election.
(v) The wickets fallen from 1 over to 50th over in a one day cricket match. -
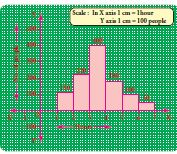
In a village, there are 570 people who have cell phones. An NGO survey their cell phone usage.
Based on this survey a histogram is drawn. Answer the following questions.
(i) How many people use the cell phone for less than 3 hours?
(ii) How many of them use the cell phone for more than 5 hours?
(iii) Are people using cell phone for less than1 hour?
2 Marks
5 x 2 = 10
 8th Standard Maths Syllabus

Reviews & Comments about 8th Standard English Medium Maths Subject Term 3 Statistics Book Back 2 Mark Questions with Solution Part - I
Write your Comment