- State Board
-
12th Standard
-

Biology
-

Computer Applications
-

Computer Science
-

Business Maths and Statistics
-

Commerce
-

Economics
-

Maths
-

Chemistry
-

Physics
-
Computer Technology
-

History
-

Accountancy
-

Tamil
-
Maths
-
Chemistry
-

Physics
-

Biology
-
Computer Science
-

Business Maths and Statistics
-
Economics
-
Commerce
-
Accountancy
-
History
-
Computer Applications
-
Computer Technology
-

English
12th Standard stateboard question papers & Study material
தமிழ் Subjects
English Subjects
-
-
11th Standard
-
Maths
-
Biology
-

உயிரியல் - தாவரவியல்
-
Economics
-
Physics
-
Chemistry
-
History
-

Business Maths and Statistics
-

Computer Science
-
Accountancy
-
Commerce
-
Computer Applications
-
Computer Technology
-
Tamil
-
Maths
-
Commerce
-
Economics
-
Biology
-
Business Maths and Statistics
-
Accountancy
-
Computer Science
-
Physics
-
Chemistry
-
Computer Applications
-
History
-
Computer Technology
-
Tamil
-
English
11th Standard stateboard question papers & Study material
தமிழ் Subjects
English Subjects
-
-
9th Standard
-
-

-

-
-
-
-
Maths
-
Science
-
Social Science
-
Maths
-
Science
-
Social Science
9th Standard stateboard question papers & Study material
தமிழ் Subjects
English Subjects
-
-
6th Standard
-
Maths
-
Science
-
Social Science
-
Maths
-
Science
-
Social Science
6th Standard stateboard question papers & Study material
தமிழ் Subjects
English Subjects
-
-
10th Standard
-
Maths
-
Science
-
Social Science
-
Tamil
-
Maths
-
Science
-
Social Science
-
English
-
English
10th Standard stateboard question papers & Study material
தமிழ் Subjects
English Subjects
-
-
7th Standard
-
Maths
-
Science
-
Maths
-
Science
-
Social Science
7th Standard stateboard question papers & Study material
தமிழ் Subjects
English Subjects
-
-
8th Standard
-
கணிதம் - old
-
Science
-
Social Science
-
கணிதம்
-
Maths
-
Science
-
Social Science
8th Standard stateboard question papers & Study material
தமிழ் Subjects
English Subjects
-
-
12th Standard
- CBSE Board
-
12th Standard CBSE
-

Biology
-

Physics
-

Chemistry
-

Maths
-

Accountancy
-

Introductory Micro and Macroeconomics
-

Business Studies
-

Economics
-

Computer Science
-

Geography
-

English
-

History
-

Indian Society
-

Physical Education
-

Sociology
-

Tamil
-

Bio Technology
-

Engineering Graphics
-

Entrepreneurship
-

Hindi Core
-
Hindi Elective
-

Home Science
-

Legal Studies
-

Political Science
-

Psychology
12th Standard CBSE Subject Question Paper & Study Material
-
-
11th Standard CBSE
-
Mathematics
-
Chemistry
-
Biology
-
Physics
-
Business Studies
-
Accountancy
-
Economics
-
Computer Science
-
Bio Technology
-
English
-
Enterprenership
-
Geography
-
Hindi
-
History
-
Home Science
-
Physical Education
-
Political Science
-
Psychology
-
Sociology
-

Applied Mathematics
11th Standard CBSE Subject Question Paper & Study Material
-
- 10th Standard CBSE
-
9th Standard CBSE
-
Mathematics
-

Social Science
-

Science
-
English
-
Hindi
9th Standard CBSE Subject Question Paper & Study Material
-
-
8th Standard CBSE
-
Science
-

Social Science
-
Mathematics
-
English
8th Standard CBSE Subject Question Paper & Study Material
-
-
7th Standard CBSE
-
Mathematics
-
Science
-
Social Science
-
English
7th Standard CBSE Subject Question Paper & Study Material
-
-
6th Standard CBSE
-
Mathematics
-
Science
-
Social Science
-
English
6th Standard CBSE Subject Question Paper & Study Material
-
-
12th Standard CBSE
- Free Online Test
- News
- Study Materials
-
Students
-

Stateboard Tamil Nadu
-

CBSE Board
-

Free Online Tests
-

Educational News
-

Scholarships
-

Entrance Exams India
-

Video Materials
Study Materials , News and Scholarships
-
-
Students


8th Standard English Medium Maths Subject Term 3 Statistics Book Back 2 Mark Questions with Solution Part - II Jun-15 , 2021
QB365 provides detailed and simple solution for every book back questions in class 8 Maths subject.It will helps to get more idea about question pattern in every book back questions with solution.
8th Standard English Medium Maths Subject Term 3 Statistics Book Back 2 Mark Questions with Solution Part - II
8th Standard
-
Reg.No. :
Maths
Time :
01:00:00 Hrs
Total Marks :
10
-
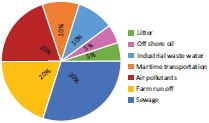
Write any five points from the given pie chart information regarding pollutants entering in the oceans.
-
In a study of dental problem, the following data were obtained.
Ages 0-10 10-20 20-30 30-40 40-50 50-60 60-70 70-80 No. of patients 5 13 25 14 30 35 43 50 Represent the above data by a frequency polygon
-
Draw a pie chart for the given table.
Continent Asia Africa North America South America Europe Australia Antarctica Area 30 % 20 % 16 % 12 % 7 % 6 % 9 % -
Form a continuous frequency distribution table and draw histogram from the following data.
Age (in years) No. of persons Under 5 1 Under 10 12 Under 20 26 Under 25 27 Under 30 35 Under 35 38 Under 40 45 Under 45 48 Under 50 53 -
Draw a histogram for the following data.
Mid Value (x) 15 25 35 45 55 65 75 Frequency (f) 12 24 30 18 26 10 8
2 Marks
5 x 2 = 10
 8th Standard Maths Syllabus

Reviews & Comments about 8th Standard English Medium Maths Subject Term 3 Statistics Book Back 2 Mark Questions with Solution Part - II
Write your Comment