- State Board
-
12th Standard
-

Biology
-

Computer Applications
-

Computer Science
-

Business Maths and Statistics
-

Commerce
-

Economics
-

Maths
-

Chemistry
-

Physics
-
Computer Technology
-

History
-

Accountancy
-

Tamil
-
Maths
-
Chemistry
-

Physics
-

Biology
-
Computer Science
-

Business Maths and Statistics
-
Economics
-
Commerce
-
Accountancy
-
History
-
Computer Applications
-
Computer Technology
-

English
12th Standard stateboard question papers & Study material
தமிழ் Subjects
English Subjects
-
-
11th Standard
-
Maths
-
Biology
-

உயிரியல் - தாவரவியல்
-
Economics
-
Physics
-
Chemistry
-
History
-

Business Maths and Statistics
-

Computer Science
-
Accountancy
-
Commerce
-
Computer Applications
-
Computer Technology
-
Tamil
-
Maths
-
Commerce
-
Economics
-
Biology
-
Business Maths and Statistics
-
Accountancy
-
Computer Science
-
Physics
-
Chemistry
-
Computer Applications
-
History
-
Computer Technology
-
Tamil
-
English
11th Standard stateboard question papers & Study material
தமிழ் Subjects
English Subjects
-
-
9th Standard
-
-

-

-
-
-
-
Maths
-
Science
-
Social Science
-
Maths
-
Science
-
Social Science
9th Standard stateboard question papers & Study material
தமிழ் Subjects
English Subjects
-
-
6th Standard
-
Maths
-
Science
-
Social Science
-
Maths
-
Science
-
Social Science
6th Standard stateboard question papers & Study material
தமிழ் Subjects
English Subjects
-
-
10th Standard
-
Maths
-
Science
-
Social Science
-
Tamil
-
Maths
-
Science
-
Social Science
-
English
-
English
10th Standard stateboard question papers & Study material
தமிழ் Subjects
English Subjects
-
-
7th Standard
-
Maths
-
Science
-
Maths
-
Science
-
Social Science
7th Standard stateboard question papers & Study material
தமிழ் Subjects
English Subjects
-
-
8th Standard
-
கணிதம் - old
-
Science
-
Social Science
-
கணிதம்
-
Maths
-
Science
-
Social Science
8th Standard stateboard question papers & Study material
தமிழ் Subjects
English Subjects
-
-
12th Standard
- CBSE Board
-
12th Standard CBSE
-

Biology
-

Physics
-

Chemistry
-

Maths
-

Accountancy
-

Introductory Micro and Macroeconomics
-

Business Studies
-

Economics
-

Computer Science
-

Geography
-

English
-

History
-

Indian Society
-

Physical Education
-

Sociology
-

Tamil
-

Bio Technology
-

Engineering Graphics
-

Entrepreneurship
-

Hindi Core
-
Hindi Elective
-

Home Science
-

Legal Studies
-

Political Science
-

Psychology
12th Standard CBSE Subject Question Paper & Study Material
-
-
11th Standard CBSE
-
Mathematics
-
Chemistry
-
Biology
-
Physics
-
Business Studies
-
Accountancy
-
Economics
-
Computer Science
-
Bio Technology
-
English
-
Enterprenership
-
Geography
-
Hindi
-
History
-
Home Science
-
Physical Education
-
Political Science
-
Psychology
-
Sociology
-

Applied Mathematics
11th Standard CBSE Subject Question Paper & Study Material
-
- 10th Standard CBSE
-
9th Standard CBSE
-
Mathematics
-

Social Science
-

Science
-
English
-
Hindi
9th Standard CBSE Subject Question Paper & Study Material
-
-
8th Standard CBSE
-
Science
-

Social Science
-
Mathematics
-
English
8th Standard CBSE Subject Question Paper & Study Material
-
-
7th Standard CBSE
-
Mathematics
-
Science
-
Social Science
-
English
7th Standard CBSE Subject Question Paper & Study Material
-
-
6th Standard CBSE
-
Mathematics
-
Science
-
Social Science
-
English
6th Standard CBSE Subject Question Paper & Study Material
-
-
12th Standard CBSE
- Free Online Test
- News
- Study Materials
-
Students
-

Stateboard Tamil Nadu
-

CBSE Board
-

Free Online Tests
-

Educational News
-

Scholarships
-

Entrance Exams India
-

Video Materials
Study Materials , News and Scholarships
-
-
Students


Statistics Important Five Mark Question Paper In 6th Maths Aug-03 , 2018
From the chapter Statistics, some of the important Five Mark questions are covered in this question paper. The questions are covers from the book back and the previous year questions.
Teachers can prepared question paper with answer key within five minutes. Please Click Here for subscribe
Statistics - Important Five Mark Question Paper
6th Standard
-
Reg.No. :
Maths
Time :
01:00:00 Hrs
Total Marks :
60
-
Thamarai is fond of reading books. The number of pages read by her on each day during the last 40 days are given below. Make a Tally Marks table.
13 5 6 643 5 4 1 6 2 5 3 4 1 6 6 5 5 1
12 3 2 542 4 1 6 2 5 5 6 5 5 3 5 2 5 1 -
Viji threw a die 30 times and noted down the result each time as follows. Prepare a table on the numbers shown using Tally Marks.
14 3 5 5 6 6 4 3 5 4 5 6 5 2
4 2 6 5 5 6 6 4 5 6 6 5 4 1 1 -
The pictograph shows the number of branded mobile phones sold in fi ve months.
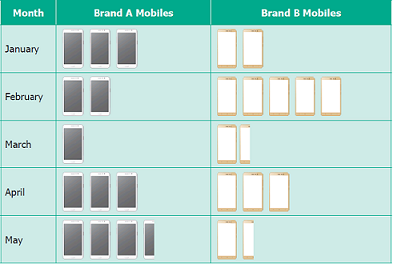
Each picture of represents 100 mobiles each
  represents 50 mobiles.
Observe the given table and answer the following questions.
(i) In which month was the maximum number of brand B mobiles sold?
(ii) In which month was equal number of brand A and brand B mobiles sold?
(iii) In which month was the minimum number of brand A mobiles sold?
(iv) Find the total number of Brand A Mobiles that were sold in 5 months.
(v) What is the difference between the sale of brand A and brand B Mobiles in the month of May? -
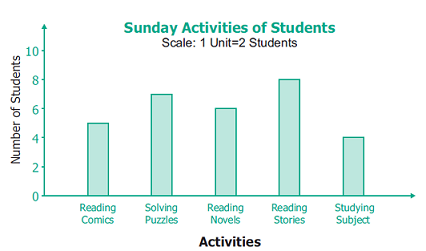
Study the above Bar graph and answer the following questions.
(i) Which activity is followed by maximum number of students?
(ii) How many students in all, spend their time on solving puzzles?
(iii) The total number of students who follow either reading stories or reading their subjects is__________.
(iv) The activity followed by minimum number of students is__________.
(v) The number of students who took part in reading comics is_______________. -
The heights (in centimeters) of 40 children are.
110 112 112 116 119 111 113 115 118 120
110 113 114 111 114 113 110 120 118 115
112 110 116 111 115 120 113 111 113 120
115 111 116 112 110 111 120 111 120 111
Prepare a tally mark table. -
Following are the choice of sports for 20 students of class VI.
Cricket Football Cricket Tennis Cricket Badminton Football Cricket Football Tennis Cricket Badminton Basketball Football Golf Football Hockey Football Hockey Cricket Arrange the names of sports in a table using tally marks.
-
Prepare a pictograph for the students of a class in various sections and answer the following questions
Class Number of Students VIA 60 VIB 25 VIC 30 VID 75 VIE 20 (a) How many pictures represent students of class VI E
(b) Which section has the maximum number of students?
(c) Which section has the least number of students. -
The number of bottles of honey sold by three different shops are given below
Shops Number of bottles of Honev Shoo A 80 ShooB 140 ShooC 180 (A) Draw a pictograph and answer the following questions {use the scale
 -20 bottles)
(a) What is the total profit of shop A, if the profit gabled on each bottle is 'E'150?
(b) If the total number of bottles sold is 400 how many figures must drawn for shops?
(c) Find the difference between the number of bottles sold by shop Band number of bottles sold by shop 'C'. -
Ragavi's father is a mobile shop owner. She finds the following data of sale of mobiles in a week.
Day Number of Mobiles sold Monday 50 Tuesday 45 Wednesday 40 Thursday 20 Friday 35 Saturday 30 Sunday 55 Draw a vertical and horizontal bar graph
-
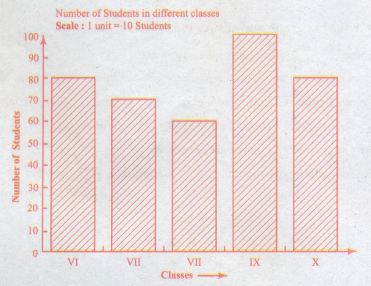
The above bar graph shows the number of students in different classes of a school. Read the graph and answer the following questions.
(a) How many students are in class X?
(b) How many students are in class VII?
(c) How many students are in class IX? -
The number of mathematics books sold by a shopkeeper on six consecutive days is shown below.
Days Sunday Monday Tuesday Wednesday Thursday Friday Number of books sold 65 40 30 50 20 70 Draw a bar graph to represent the above information choosing the scale of your choice.
-
The following bar graph shows the number of people visited Mahabalipuram over a period of 5
months.
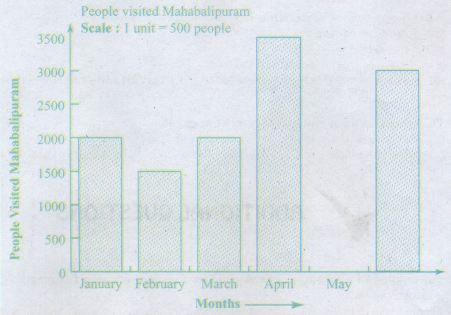
Use the graph to answer the following questions
(a) How many people visited Mahabalipuram in April?
(b) How many more people visited Mahabalipuram in May than in January?
(c) In which month, were there as many visitors as on March?
(d) In which month were there 1500 more visitors than in January?
(e) How many visitors were there in 5 months?
Part A
Answer all Questions
12 x 5 = 60
 6th Standard Maths Syllabus

Reviews & Comments about Statistics Important Five Mark Question Paper In 6th Maths
Write your Comment